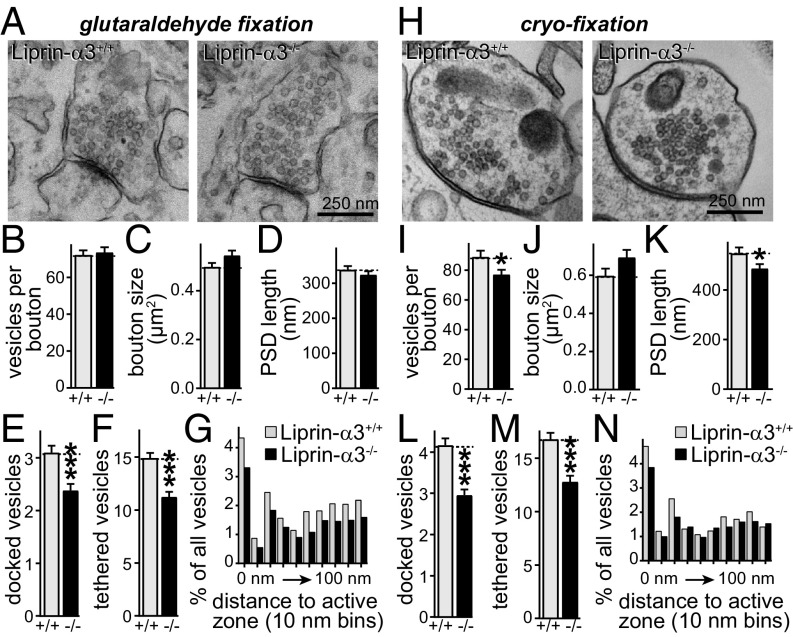
Fig. 4.
Impaired synaptic vesicle docking and tethering after Liprin-α3 KO. (A) Representative EM images of synapses of cultured hippocampal neurons fixed with glutaraldehyde. (B–F) Quantification of vesicles per bouton (B), bouton size (C), PSD length (D), docked vesicles (E), and vesicles tethered within 100 nm (F). Liprin-α3+/+, n = 150 synapses/3 independent cultures; Liprin-α3−/−, n = 147/3. (G) Histogram of the vesicle distribution in the first 100 nm of the active zone in 10-nm bins expressed as a percentage of all synaptic vesicles. Numbers of synapses and cultures are as in B–F. (H–N) Same as A–G, but for neurons cryofixed by high-pressure freezing. Liprin-α3+/+, n = 104/3; Liprin-α3−/−, n = 121/3. Data are means ± SEM unless stated otherwise (*P ≤ 0.05 and ***P ≤ 0.001, unpaired Student’s t test).

