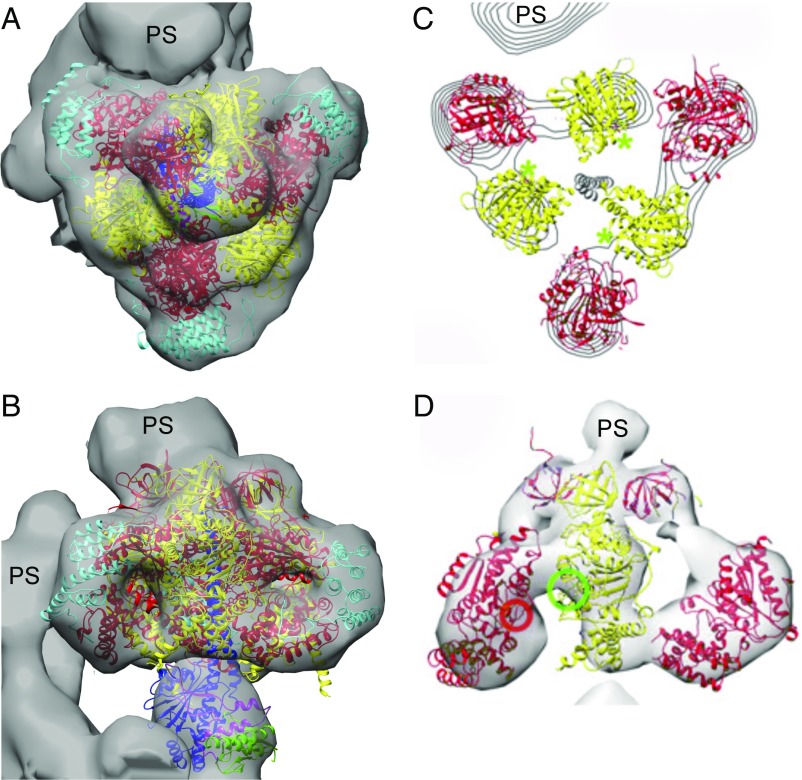
Fig. 4.
Relationship of the crystallographic structure of the F1-domain of the ATP synthase from T. brucei to an ECT map of the intact ATP synthase in situ in mitochondrial membranes from T. brucei. The subunits of the F1-domain are colored as in Fig. 1. (A and B) Top (A) and side (B) views of the ECT map (gray), determined independently at 32.5-Å resolution with the crystallographic structure of the F1-domain determined at 3.2-Å resolution docked manually inside the ECT map, with subunits αDP and βTP proximal to the peripheral stalk. (C and D) A published interpretation of the same ECT map proposing a structure of T. brucei F1-ATPase in which the α-subunit is opened away from the central stalk, with the p18-subunit (not shown) contributing to the catalytic sites by providing the arginine finger residue (red circle) in D (42). The catalytic sites are indicated by green asterisks in C and by a green circle in D. PS, peripheral stalk of the enzyme. C and D modified from ref. 42.

