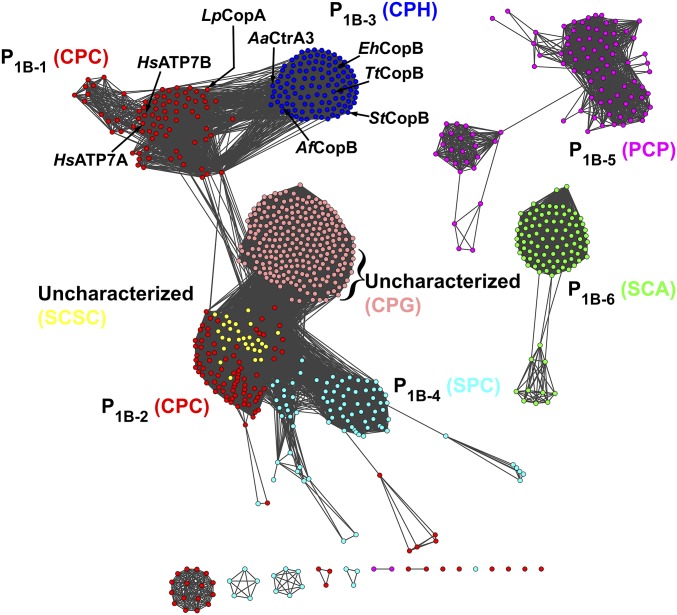
Fig. 5.
The extended P1B-ATPase similarity network. Sequences are represented as nodes (colored circles), and the strength of their similarity is indicated by edges (lines connecting colored circles). Sequences are color coded and labeled by their signature TM helix 4 motifs. The pink cluster represents newly identified sequences containing a conserved CPG motif. Representative CopAs and CopBs discussed in the text are labeled.

