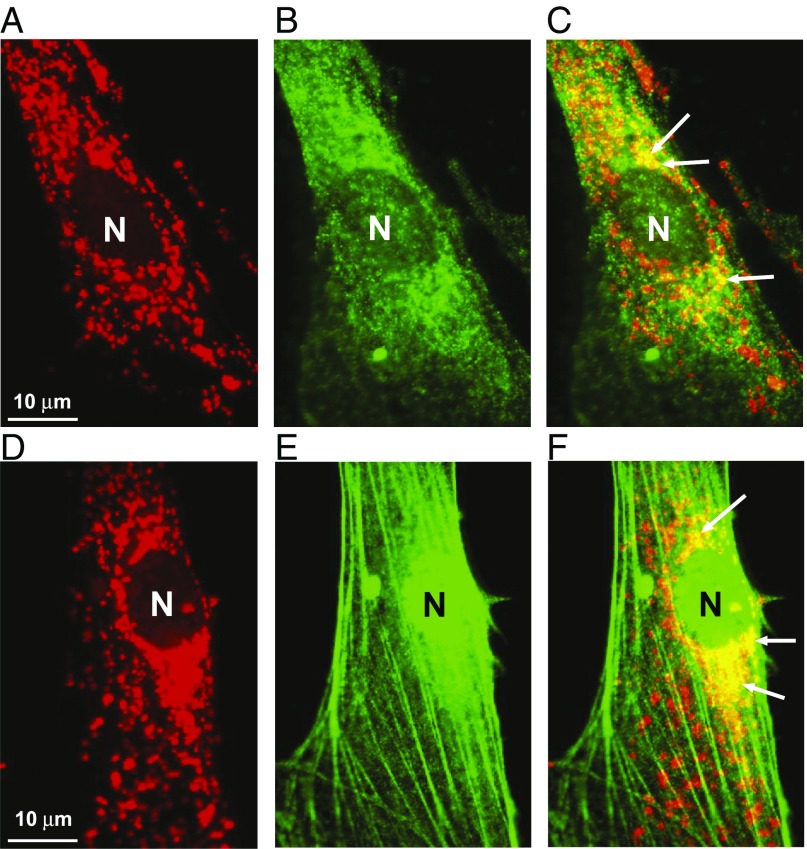
Fig. 1.
Localization of melatonin receptors MT1 and MT2 in MM of gastric endothelial cells (GECs). (A) Staining of mitochondria using MitoTracker, a fluorescent dye that stains mitochondria (red) in a manner dependent on mitochondrial membrane potential. (B) Immunofluorescence staining for MT1 in GECs (green). (C) Overlay of MitoTracker and MT1 immunostaining images showing localization of MT1 in MM as yellow/orange staining (arrows). (D) Staining of mitochondria using MitoTracker (red). (E) Immunofluorescence staining for MT2 in GECs (green); please note strong MT2 expression in the nucleus (N). (F) Overlay of MitoTracker and MT2 immunostaining images showing localization of MT2 in MM as yellow/orange staining (arrows).

