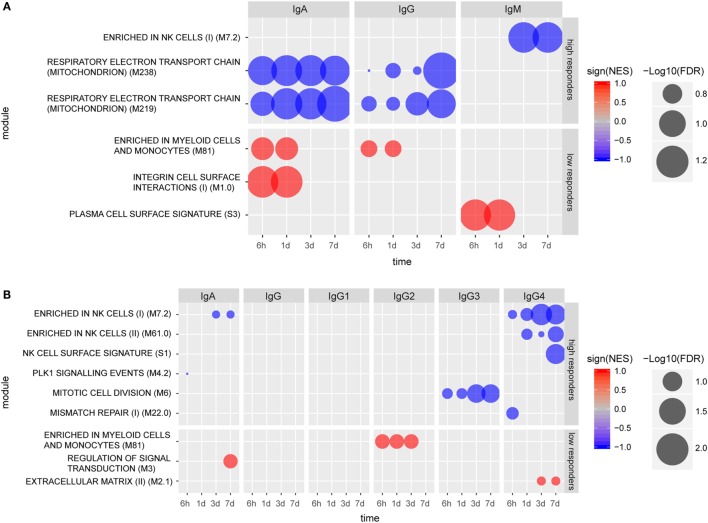
Figure 3.
Molecular signatures associated with early (A) and late (B) humoral responses. Blood transcription modules (BTMs) at early time points (6 h, 1 day, 3 days, and 7 days) associated with IgA (measured at 14 days), IgG (measured at 28 days), and IgM (measured at 28 days) responses in high and low responders (A). BTMs at early time points (6 h, 1 day, 3 days, and 7 days) associating with IgA, IgG, IgG1, IgG2a, IgG3, and IgG4, all measured at 168 days except IgG3 (measured at 84 days) responses in high and low responders (B). Size of the circles indicate level of significance [−log10(FDR)]. Only BTMs with FDR q value < 0.25 are included in the plot. Negative association is indicated by blue color and positive association is indicated by red color.

