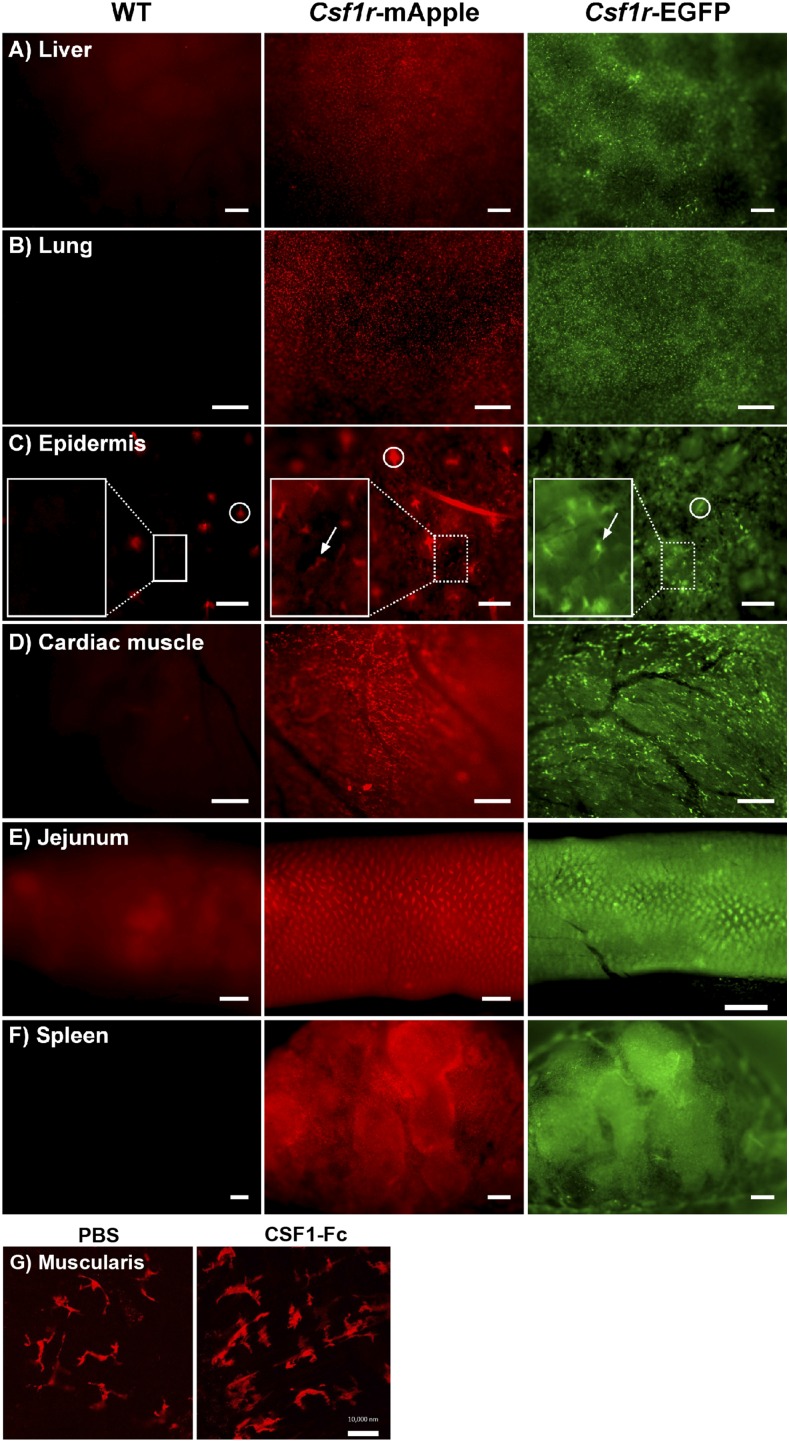
FIGURE 1.
Distribution of the Csf1r-mApple and Csf1r-EGFP transgenes is similar throughout tissues. Whole-mount imaging of freshly isolated liver (A), lung (B), skin epidermis (C), cardiac muscle (D), jejunum (E), and cross-section of spleen (F) from WT (left panel), Csf1r-mApple (central), and Csf1r-EGFP (right panel) mice, or from muscularis (G) of Csf1r-mApple mice treated with PBS (left panel) or CSF1-Fc (right panel). In (C), a region of interest has been further magnified to better show Langerhans cells (white arrows), and hair follicles can be detected as highly autofluorescent structures (white circles). Scale bars in skin represent 100 μm; 200 μm in liver, spleen, and cardiac muscle; 500 μm in lung and jejunum; and 10 μm in the muscularis.

