FIGURE 3.
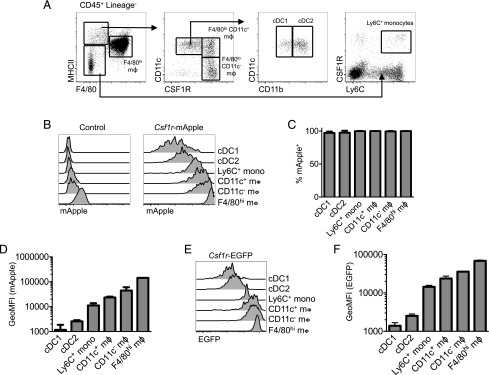
Csf1r transgene and CSF1R protein expression in the peritoneal cavity. (A) Flow cytometric strategy to identify peritoneal cavity myeloid cells as recently described (23). (B–D) Expression of Csf1r-mApple in peritoneal cavity myeloid populations determined by flow cytometry, showing a representative WT littermate control (left) and Csf1r-mApple (right) mouse (B), and graphs depicting the mean frequency of Csf1r-mApple+ cells in each population (C) and geometric mean fluorescence intensity (GeoMFI) of Csf1r-mApple for different peritoneal leukocytes gated on Csf1r-mApple+ cells (D). (E and F) Expression of Csf1r-EGFP in peritoneal cavity myeloid populations from Csf1r-EGFP mice, showing a representative flow cytometric overlay (E) and graphs depicting the frequency and GeoMFI of Csf1r-EGFP+ cells in each population (F) across multiple mice. Representative data from one of three experiments (B–D) or a single experiment (E and F). Data are presented as mean ± SD of four mice (C, D, and F).

