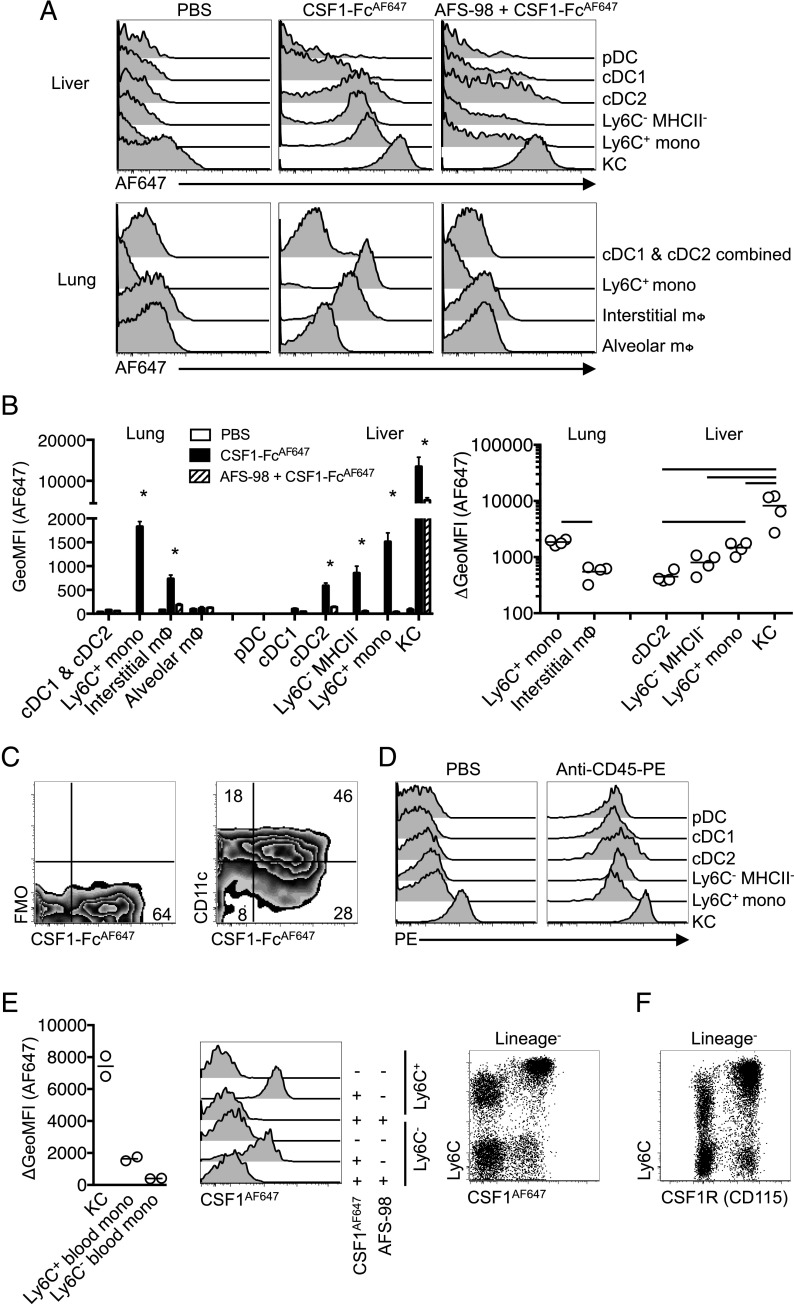
FIGURE 6.
Tissue-specific consumption of CSF1 by cDC2 in vivo. (A) Histograms of AF647 fluorescence of leukocyte populations from lung and liver following i.v. injection of anti-CSF1R mAb AF-S98 or PBS vehicle before subsequent i.v. delivery of CSF1-FcAF647 or PBS vehicle. (B) Geometric mean fluorescence intensity (GeoMFI) of AF647 of cells from mice in (A) (left graph) and change in MFI between mice given CSF1-FcAF647 alone or after AFS-98 pretreatment (right graph), with data presented as mean ± SEM of four mice per group (left), or with data points for individual mice shown (right). Data are from one of two repeat independent experiments. (C) Representative plots showing CSF1-FcAF647 uptake versus CD11c expression or FMO control on hepatic cDC2 from mice in (A). (D) PE fluorescence of liver leukocytes from C57BL/6 mice injected i.v. with anti–CD45-PE mAb or PBS vehicle 2 min prior to necropsy, showing data from one representative mouse of two per group. (E) Histograms of AF647 fluorescence of Ly6C+ and Ly6C− blood monocytes from mice treated as in (A) but given CSF1AF647, and a graph showing change in GeoMFI of blood monocytes and liver KC between mice given CSF1AF647 alone or after pretreatment with AFS98, and a dot plot showing Ly6C versus AF647 uptake on all CD3−CD19−Ly6G− blood cells with data points representing individual mice. (F) Conventional surface CSF1R (CD115) and Ly6C staining on CD3−CD19−Ly6G− blood cells from naive mice. Data are from one representative experiment of two (B–D and F) or three (E) independent repeats. The asterisk (*) indicates significant differences between CSF1-FcAF647 alone and AFS98 + CSF1-FcAF647 using t tests corrected for multiple comparisons with the Holm–Sidak method (B, left graph), whereas lines indicate significant differences using one-way ANOVA (B, right graph).

