Figure 1.

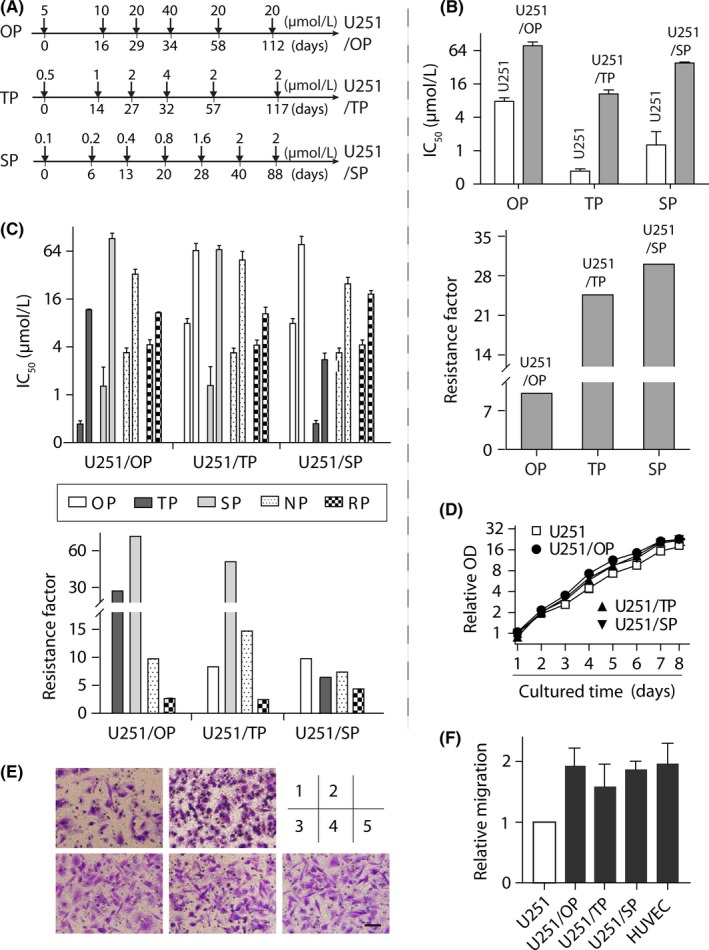
Generation of poly(ADP‐ribose) polymerase inhibitors (PARPi)‐resistant variants and their resistance profiles to PARPi. A, workflow flowcharts used to generate PARPi‐resistant cells. Phosphatase and tensin homolog (PTEN)‐deficient glioblastoma U251 cells were separately exposed to increasing concentrations of olaparib (OP), talazoparib (TP) and simmiparib (SP). The resulting PARPi‐resistant variants were denoted by U251/OP, U251/TP and U251/SP, respectively. B,C, PARPi‐resistance profiles. Cells were exposed to olaparib (OP), talazoparib (TP), simmiparib (SP), niraparib (NP) or rucaparib (RP) for 7 days and then subjected to sulforhodamine B (SRB) assays. The IC 50 value was expressed as mean ± SD from 3 separate experiments and the resistance factor was calculated as the ratio of the averaged IC 50 value of the indicated PARPi in the given resistant cells to that of the same PARPi in the parental U251 cells. B shows the resistance of a given PARPi‐resistant variant to the PARPi that was used to establish the variant while C indicates the cross‐resistance to the PARPi that were not used to establish the indicated variant. D, Growth curves of the resistant and parental U251 cells. Samples were determined by the SRB assay and their optic density (OD) values were normalized using that of the parental U251 group on day 1 (relative OD). E, representative images of cell migration from 3 independent Transwell migration assays. 1, U251; 2, HUVEC; 3, U251/OP; 4, U251/TP; 5, U251/SP. Scale bar: 50 μm. F, Quantiffication results of E. Relative migration was calculated in relation to the migration of parental U251 cells. HUVEC cells served as the positive control
