
Table 2.
Diet comparison overview.
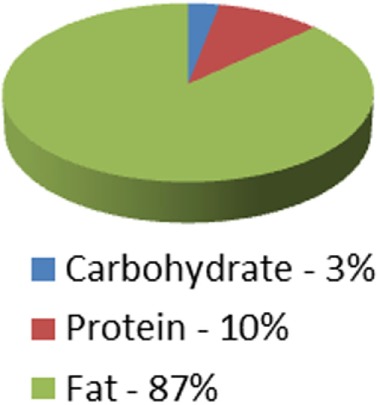
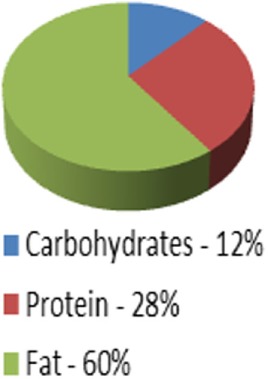
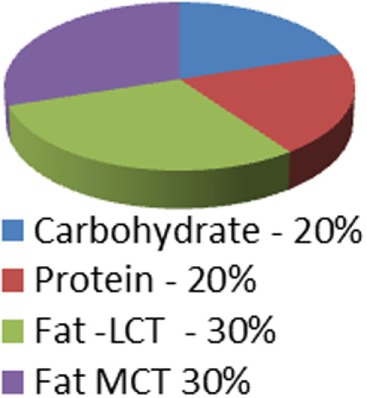
| Classic ketogenic diet (KD) 4:1 ratio | Classic KD 3:1 ratio | Low Glycemic Index treatment 1.5:1 ratio | MCT oil diet0.67:1–1.5:1 ratio | Modified atkins 0.79:1 ratio | Atkins 0.73:1 ratio | |
|---|---|---|---|---|---|---|
| Caloric distribution charts | 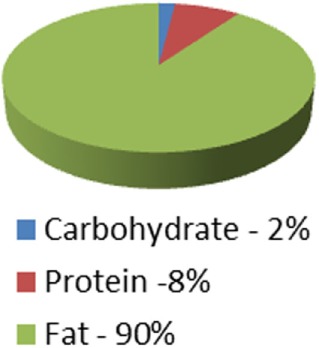 |
 |
 |
 |
 |
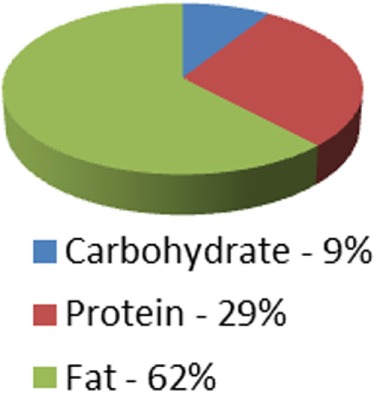 |
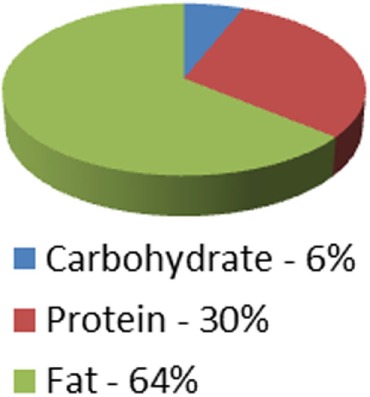
| Fat portion of calories | 180 g | 174 g | 120 g | 120 g; 60% fat: start with 30% MCT, 30% LCT then may adjust up to 50% MCTa and decrease LCT down to 10% as tolerated | High fat encouraged | High fat encouraged |
| Although not measured: At 64% of calories = 128 g | Although not measured: At 62% of calories = 124 g | |||||
| Protein portion of calories | 36 g | 45 g | 126 g | 90 g (can be adjusted up or down) | Although not measured = at 30% of calories = 135 g | Although not measured = at 29% of calories = 131 g |
| Carbohydrate portion of calories | 9 g | 15 g | 54 g | 90 g (can be adjusted up or down) | 10–15 g/day for first month | 20 g/day for first two weeks |
| 20 + 5 g/day until 10 lbs from goal weight | ||||||
| 20–30 g/day afterward | +10 g/day until goal weight reached | |||||
| How are foods measured? | Weighted on digital gram scale | Weighted on digital gram scale | Using household measurements, exchange lists or estimated | Uses exchange lists | Estimated | Estimated |
| Calories controlled | Yes | Yes | Yes | Yes | No | No |
| Presence of urine ketones | Yes | Yes | No | Yesa but may need the higher amount of MCT and or ratio adjusted to decrease carb/protein | Yes if protein intake controlled | Yes if protein intake controlled |
aDiets adjusted to 1,800 kcal diet for comparison purposes only.
LCT, long-chain triglycerides; MCT, medium-chain triglyceride.