Fig. 3.

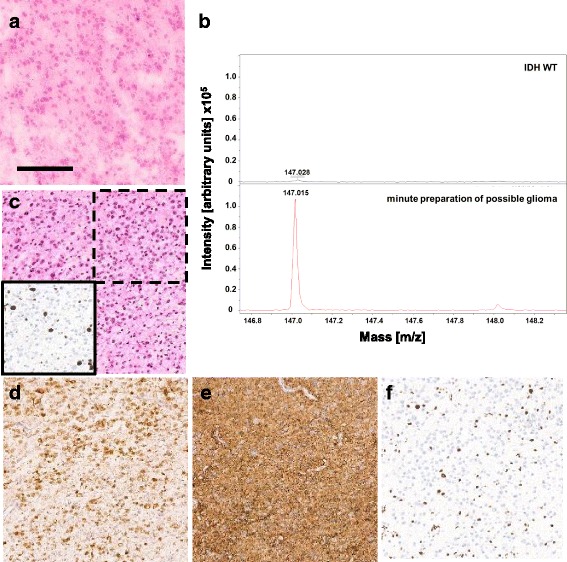
2HG measurement in real time. a H&E of frozen section, scale bar represents 150 μm. b MALDI-TOF spectra showing m/z values from 146.8 to 148.2 of one IDH wildtype as negative control and the minute preparation tissue with the matrix 1,5-DAN. Peaks at m/z 147 correspond to 2HG. c H&E staining of FFPE-tissue of the same case. Lower left box shows the Ki67 staining of the upper right dashed box. d IDH1R132H staining of the tissue shows IDH1R132H positive tumor cells. e GFAP staining of the tissue shows positive tumor cells. f ATRX staining shows loss of ATRX staining in tumor cells
