
Fig. 4.
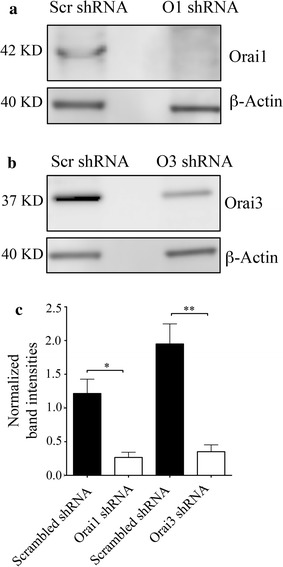
Knockdown of Orai1 and Orai3 were validated using western blotting. a Representative western blots showing knockdown of Orai1. b Representative western blots showing knockdown of Orai3. c Bar chart showing average Orai1 and Orai3 band intensities normalized to actin loading control for control and shRNA transfected cells. p < 0.05 and p < 0.01 are indicated by * and **, respectively