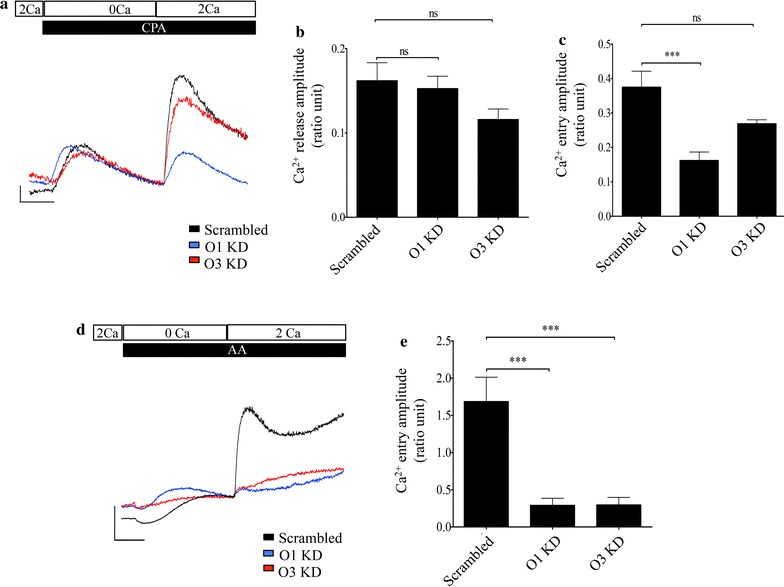
Fig. 5.

Effect of knockdown of Orai1 and Orai3 on SOCE and AA-induced Ca2+ entry. a Representative traces showing SOCE response in BON cells transfected with scrambled shRNA (black trace), Orai1 shRNA (blue trace) and Orai3 shRNA (red trace). The horizontal scale bar indicates 100 s and the vertical scale bar represents a change of 0.05 ratio units. b Bar chart showing average Ca2+ release from cells transfected with scrambled, Orai1 and Orai3 shRNAs. c Bar chart showing average SOCE responses in BON cells transfected with scrambled shRNA, Orai1 shRNA and Orai3 shRNA. d Representative traces showing AA-induced Ca2+ entry in BON cells transfected with scrambled shRNA (black trace), Orai1 shRNA (blue trace) and Orai3 shRNA (red trace). The horizontal scale bar indicates 100 s and the vertical scale bar represents a change of 0.5 ratio units. e Averaged amplitude of AA-induced Ca2+ entry in response to treatments indicated in (d). Significance of p < 0.001 is indicated by ***
