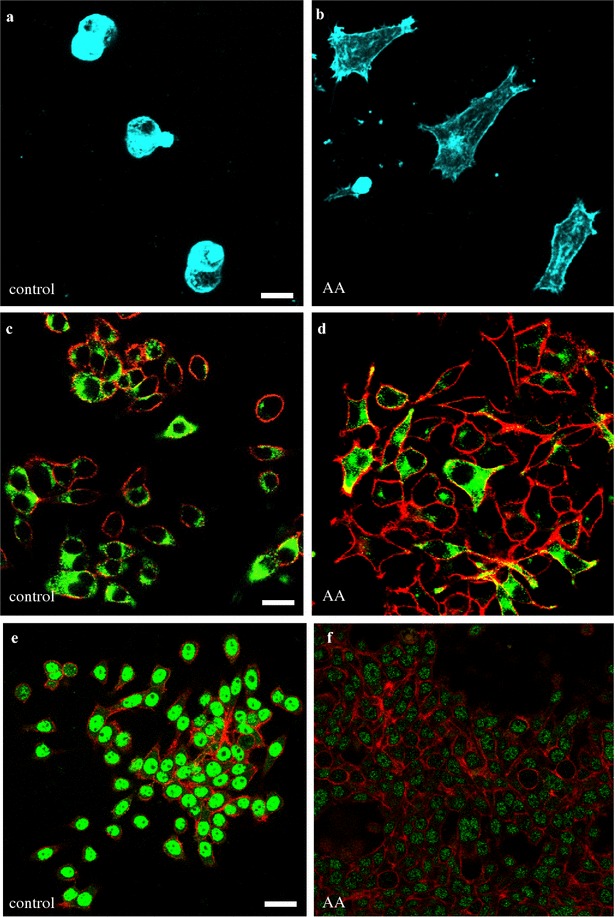
Fig. 7.

Morphological and phenotypic changes prior to or following AA treatment. a, b Confocal images of unmigrated and migrated BON cells acquired from transwell inserts following treatment with 6 µM AA for 8 h. Cell morphology was visualized by F-actin labeling with Alexa Fluor 633 conjugated phallotoxin. c, d Images of BON cell cultures following overnight treatment with vehicle alone (c) or with (d) AA treatment. Cells were labeled with antisera for CgA (green) and AlexaFluor 546 conjugated phallotoxin for F-actin (red). Percentages of cells expressing CgA were quantified under the two treatment conditions. e, f Assessment of E-cadherin expression levels (green) and F-actin (red) following overnight treatment with vehicle or AA, respectively. Each image set was obtained with the same intensity and settings to assess relative changes in fluorescence intensity evoked by treatment. Scale bars on image sets were 15, 20 and 25 µm, respectively
