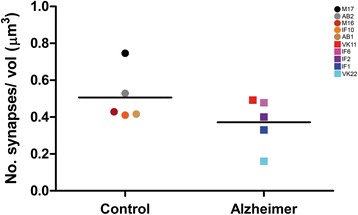
Fig. 5.

Graph showing the overall mean synaptic density in control and AD patients. Control cases are represented by circles and AD cases are represented by squares. Each color corresponds to each case analyzed in the study, as denoted in the upper right corner. No significant differences were found between groups (p-value > 0.05)
