Fig. 3.

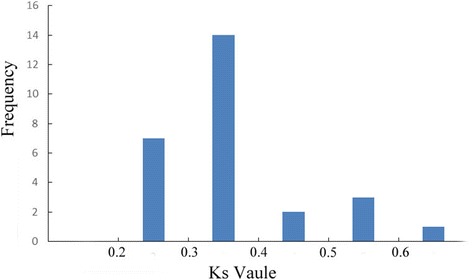
The Ks values distribution of MtN3/Saliva/SWEETs genes in the genome of B. rapa and A. thaliana. The vertical axis indicates the frequency of paired sequences, whereas the horizontal axis denotes the Ks values with an interval of 0.1

The Ks values distribution of MtN3/Saliva/SWEETs genes in the genome of B. rapa and A. thaliana. The vertical axis indicates the frequency of paired sequences, whereas the horizontal axis denotes the Ks values with an interval of 0.1