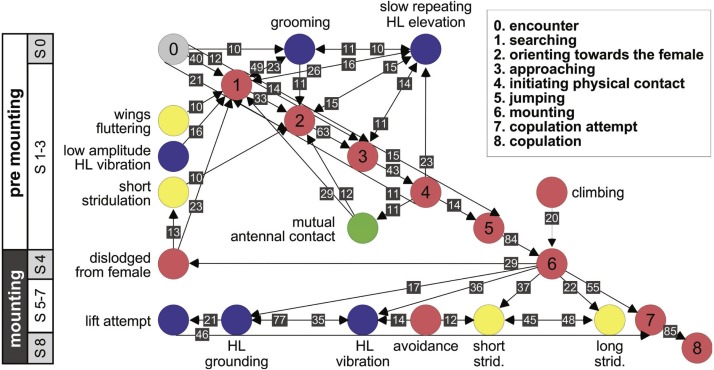
Figure 5. A kinematic diagram depicting the pre-copulatory behavior of male locusts (N = 20); arrows represent transitions between behavioral elements.
The numbers on a gray background denote the mean transitional probability (TP, %) between each pair of behavioral elements. Two way transitions are depicted by double-headed arrows (numbers relate to the closer arrow head). The color of the circles representing the different behavioral elements corresponds to the color index used in Fig. 1. The different steps in the pre-mounting and mounting stages are noted.

