
Figure 1.
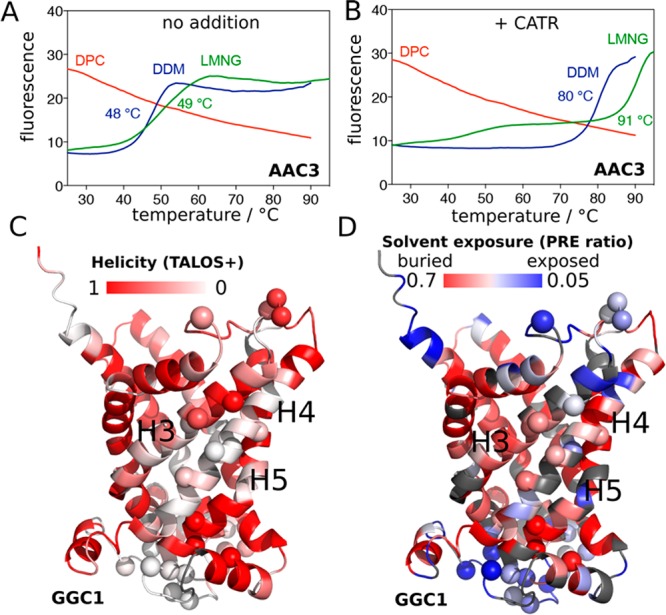
Stability of secondary and tertiary structures in MCs. (A, B) Thermostability of AAC3, extracted from yeast mitochondria and purified in DDM, diluted 20-fold into 0.1% DDM (blue line), 0.1% LMNG (green line) or 0.1% DPC (red line) in the absence (A) or presence (B) of CATR, measured with TSA experiments (see Supplementary Methods). (C) Residue-wise helix propensity in GGC1, determined from NMR chemical shifts using the program TALOS+,16 plotted onto a structural model of GGC1. Residues in white color are not in a helical conformation. (D) Residue-wise solvent accessibility in GGC1, as probed with the paramagnetic agent gadodiamide. Residues shown in white-to-blue colors are accessible to solvent. In panels C and D, amide sites undergoing μs–ms dynamics (discussed further below) are indicated by spheres.