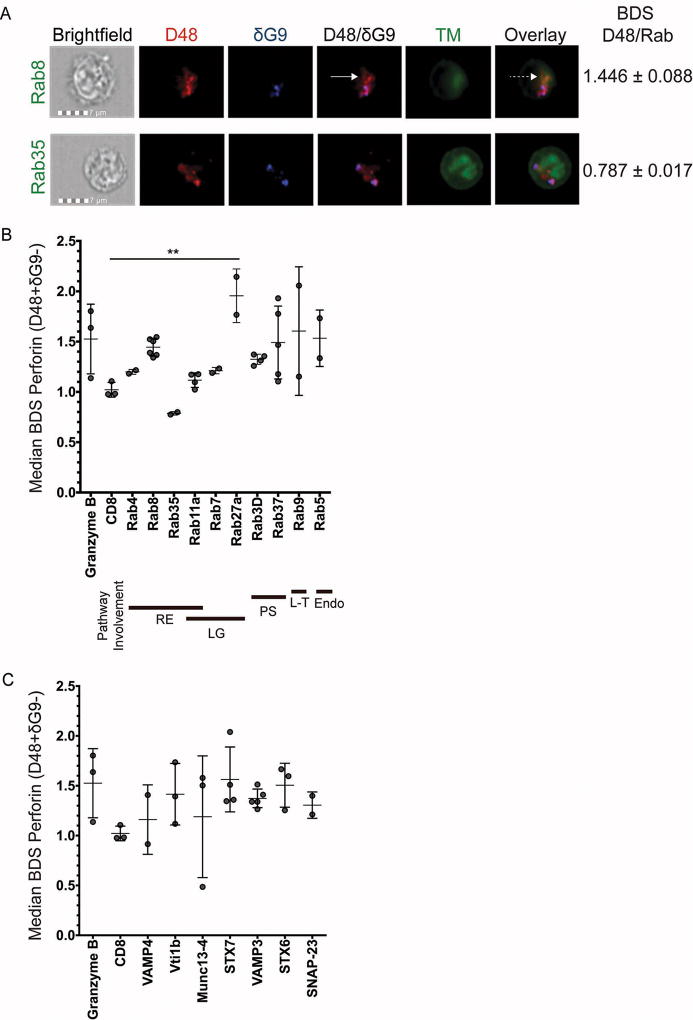
Fig 1. High-throughput analysis of perforin co-localization by imaging flow cytometry.
Antigen-specific CTL from normal human donors were expanded ex vivo for 10–14 days, re-stimulated with their cognate antigen for 6 hours, and then stained with the indicated antibodies plus anti-CD8 and anti-CD56. An imaging flow cytometer was used to capture images at 60X magnification. Representative images showing the localization of perforin with trafficking markers (TM) are shown in (A). Solid white arrows point to new perforin (D48+ δG9-) and the dashed white arrow shows co-localization between new perforin and rab8. B–C) Bright detail similarity (BDS) values indicate the similarity of the TM image with the image of new perforin (masked D48+ δG9-). The plotted BDS scores represent the median score of all D48+ δG9- spots within the cells, with each symbol denoting one experiment with one human donor. Horizontal lines depict the mean of all donors. Error bars show the standard deviation of all donors combined. Granzyme B and CD8 represent positive and negative co-localization controls, respectively. 2–4 experiments were performed for each trafficking marker, and 10–1200 cells containing new perforin were analyzed from each donor. Bold lines underneath the×axis in (B) represent the pathway(s) each rab is associated with: RE=recycling endosome, LG=lytic granule-associated, PS=(general) protein secretion, L-T=Lysosome-to-TGN trafficking, Endo=endocytosis. **p<0.01, t test compared to negative control (CD8).

