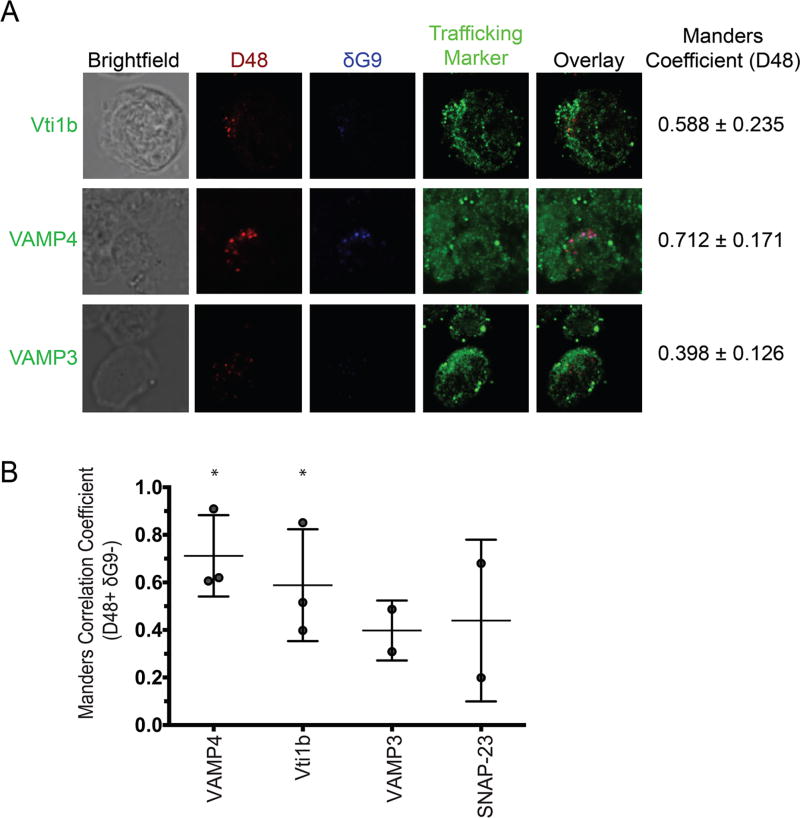
Fig 3. Newly synthesized (D48+ dG9-) perforin co-localizes with vti1b and VAMP4.
Antigen-specific CTL from normal human donors were expanded ex vivo for 10–14 days, re-stimulated with their cognate antigen for 6 hours, and then stained with the indicated antibodies and imaged on a confocal microscope with a 100X oil objective. A) Representative images showing perforin localization with SNARE proteins. Manders values shown in (A) represent the mean values of all the experiments combined. B) Manders correlation coefficients between perforin and the indicated trafficking marker were measured after selecting new perforin (D48+ δG9-) spots only. Each symbol represents the mean score of 1 donor, and the horizontal lines represent the mean of all donors. Errors bars represent the standard deviation of all the donors combined. 2–3 experiments with separate human donors were performed for each trafficking marker, and 5–20 cells were analyzed from each donor. *p<0.05, t test compared to a theoretical mean of 0 (no co-localization).

