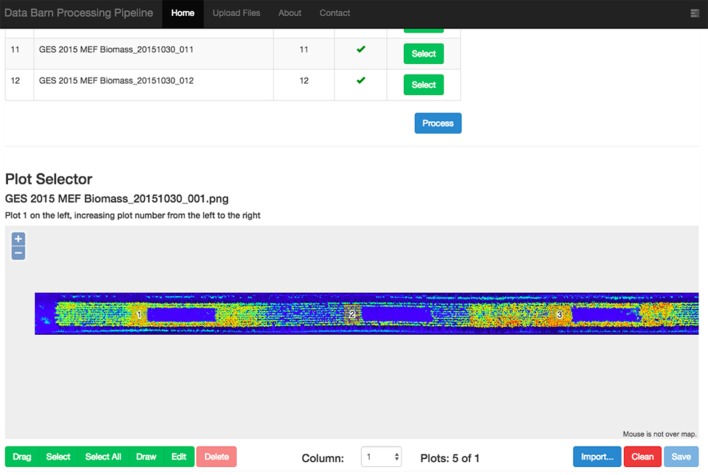
Figure 3.
Web interface of the LiDAR data processing pipeline showing a rasterised point-cloud for a column of experimental plots. The user-selected sections of the experimental plots are denoted with numbered orange rectangles. Note how the user has avoided existing biomass samples (blue boxes to the right of the numbered orange rectangles).

