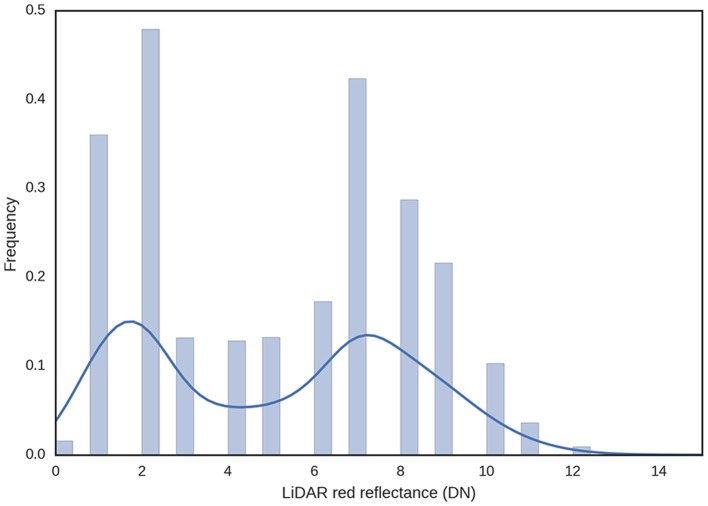
Figure 5.
Frequency distribution of LiDAR red reflectance for a typical experimental plot. Green tissue from plants will tend to absorb the red light, while soil will tend to reflect the red light. GC was estimated using a binary rule, where LiDAR intensity less than five was classified vegetation and LiDAR intensity five and above was classified as soil.

