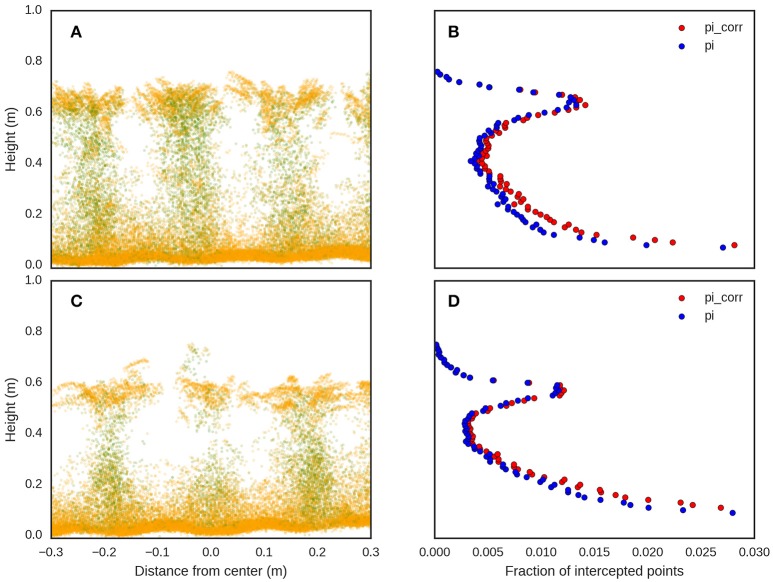
Figure 7.
LiDAR point clouds, representing the cross sections for two different experimental plots, (A,C), from the same experiment with contrasting genotypes and different above-ground biomass at maturity (8th December 2015) of 12.0 and 7.2 t/ha for (A,C) respectively. The corresponding fraction of intercepted points (pi) and corrected intercepted points (pi_corr) with k = −1, for (A,C), are shown in (B,D) respectively.

