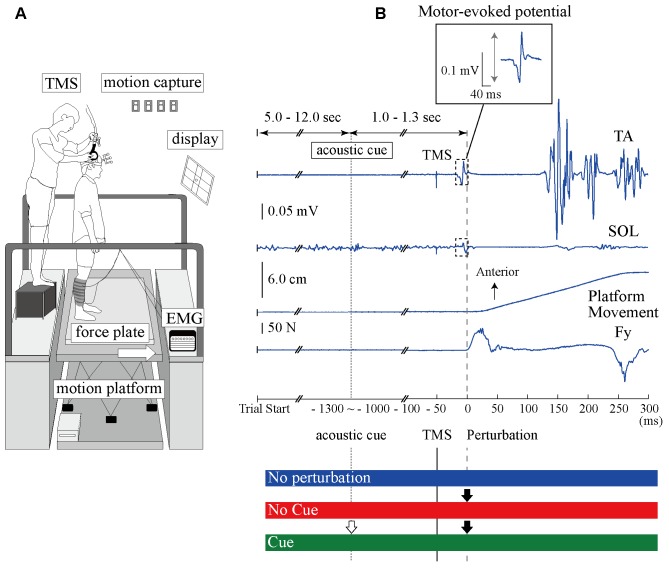
FIGURE 1.
The experimental setup and the time course of TMS and anterior-surface translation in a single trial. (A) The devices and scene of the experiment. The site of the coil is guided using the 3D motion capture system. (B) Top, middle upper, middle lower, and bottom waveforms show the TA-EMG, SOL-EMG, displacement of the platform, and the force from the surface, respectively. Zero millisecond corresponds to the perturbation onset. The EMG response evoked at around 100 ms in the TA is more pronounced compared to the SOL response. The TMS is delivered 50 ms before the perturbation onset. The interesting range for analyzing the MEP amplitude is 40 ms after TMS onset. An acoustic cue is provided 1.0–1.3 ms before perturbation in the Cue condition as timing information. The BGA was calculated by the EMG activity from –50 to 0 ms. TA, tibialis anterior muscle; SOL, soleus muscle; Fy, net force in the anteroposterior component recorded from the force plate.

