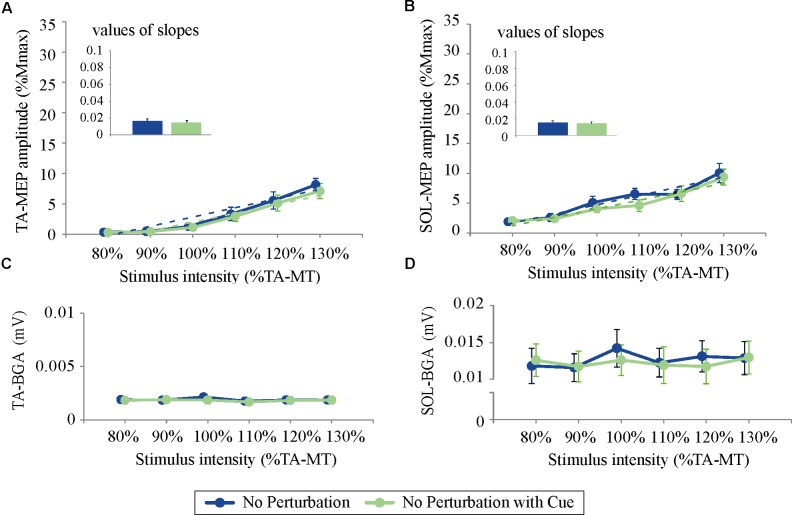
FIGURE 5.
The response–stimulus relation curves of the TA- and SOL-MEP and BGA activities in Experiment 2 (80% TA-MT–130% TA-MT). Each point is presented as the mean ± SEM. Bars represent the values of the slopes fitted by linear regression. The values of MEPs were normalized by M-max. For both the TA- (A) and the SOL-MEP (B), the mean amplitude and the values of the slopes are not different between the two conditions. The BGA is also almost the same in the two conditions (C: TA, D: SOL). No Perturbation, normal standing without any perturbations; No Perturbation with Cue, normal standing without any perturbations but with cue.

