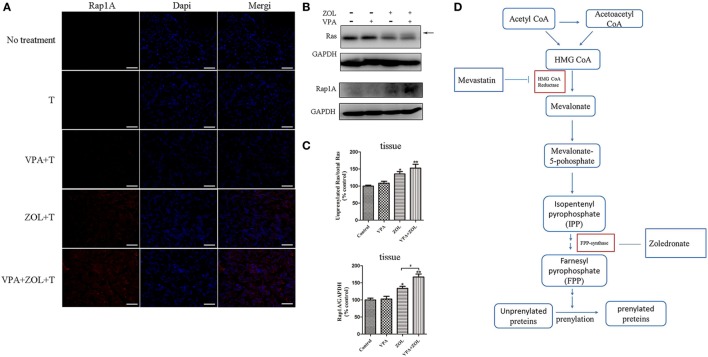
Figure 5.
Inhibition of protein prenylation by in vivo treatment on osteosarcoma. Mice in different groups were sacrificed on 21th day after 2-week treatments and tumors were dissected. The expression levels of unprenylated proteins were detected by immunofluorescence and western blot. (A) The level of unprenylated Rap1A (red) was determined by fluorescence microscopy. The nuclei were counterstained with DAPI (blue). Scale bar: 50 µm. (B,C) The levels of unprenylated Rap1A and Ras were measured by western blot. The band marked by arrow corresponded to unprenylated form of Ras and the Rap1A antibody detected unprenylated form Rap1A. (D) Mevalonate pathway blockade induced by zoledronate (ZOL). The levels of unprenyalted proteins were normalized and the relative values were presented in histograms as mean ± SD; *p < 0.05, **p < 0.01 versus control, #p < 0.05.

