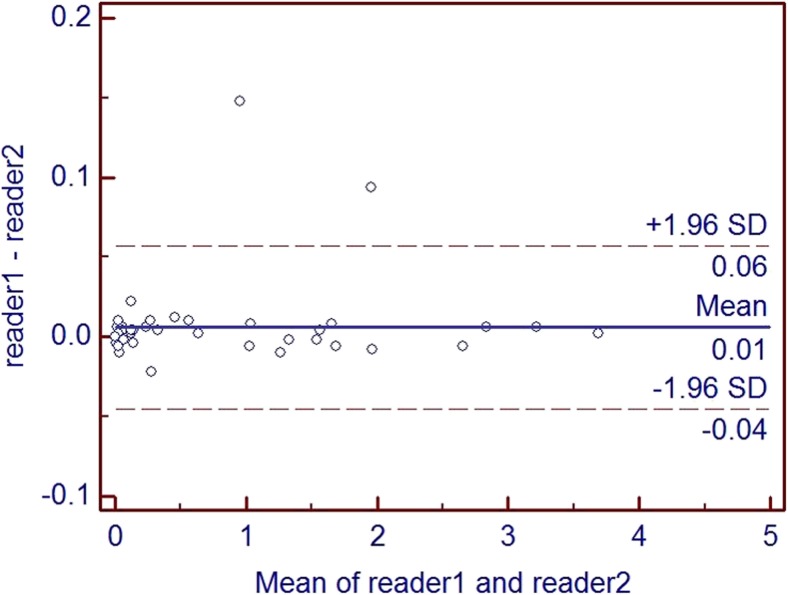
Fig. 1.
Bland–Altman plots of differences between readers. Differences in MSU crystal volumes measured by two independent readers plotted as a function of the mean MSU crystal volume. The blue solid horizontal line represents the mean difference (i.e., bias) in volumes measured by the two readers. The dashed horizontal lines represent the observed 95% limits of agreement (−0.04 to 0.06 cm3)

