Figure 2.

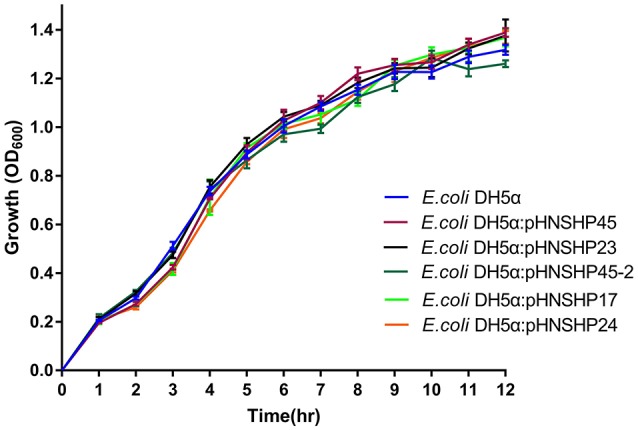
Growth curve of E. coli DH5α and isogenic transformants. Curve indicates the mean of three independent experiments. The error bars denote the 95% CI.

Growth curve of E. coli DH5α and isogenic transformants. Curve indicates the mean of three independent experiments. The error bars denote the 95% CI.