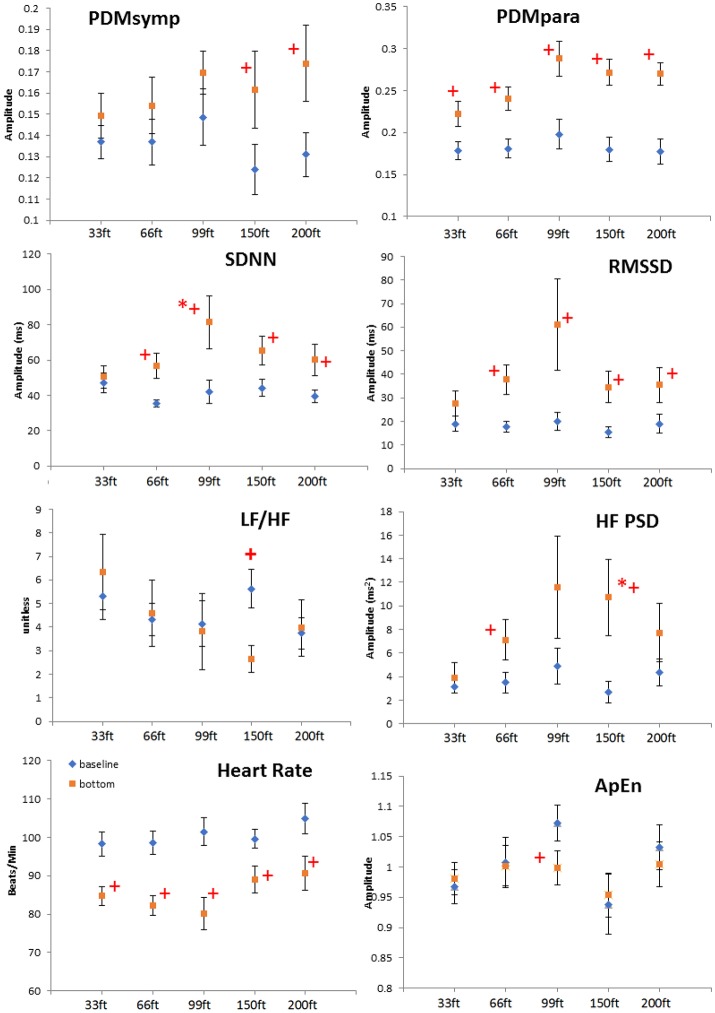
Figure 2.
Depth comparison of HRV parameters. The line marked with diamonds represents baseline; the square line is bottom condition. + means p < 0.05 when comparing the bottom to its corresponding baseline by paired t-test. *denotes p < 0.05 when comparing to the 33 ft. condition. Error bars denote standard error.

