Figure 1.

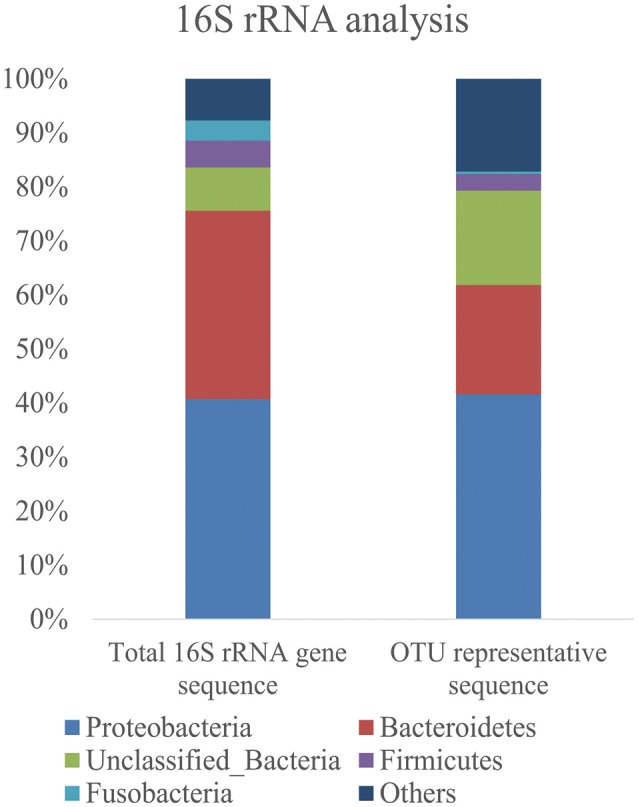
Bar graphs show the frequency of bacteria phyla identified from the Yellow Sea sediment samples. The distribution of total 16S rRNA gene sequences and representative sequences of each OTU was shown.

Bar graphs show the frequency of bacteria phyla identified from the Yellow Sea sediment samples. The distribution of total 16S rRNA gene sequences and representative sequences of each OTU was shown.