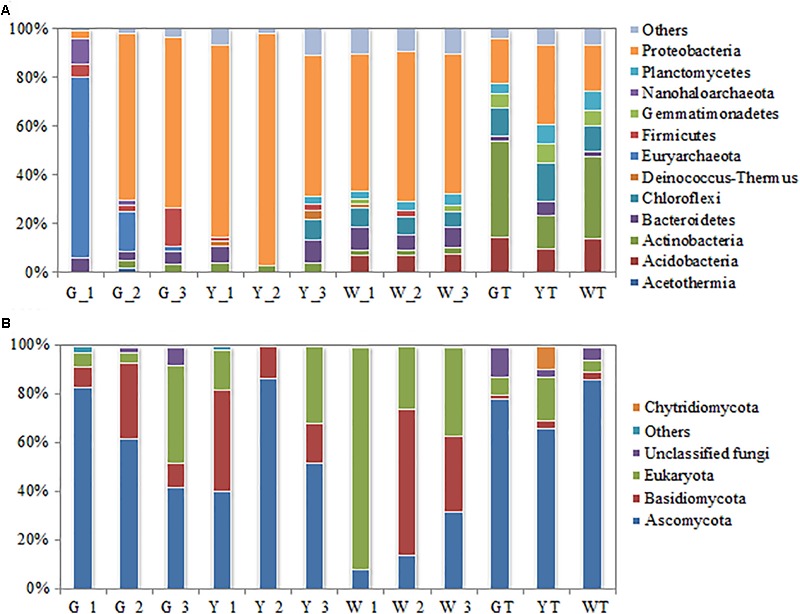
FIGURE 3.

Relative abundance of the dominant phyla in the prokaryotic (A) and fungal (B) communities from the soil-saline sediment regions. Observed OTUs in three samples from the same saline pool (or soil plot) were combined and further assigned to G_1, G_2, G_3, Y_1, Y_2, Y_3, W_1, W_2, W_3, GT, YT and WT. Only the phyla with >1% mean abundance were shown.
