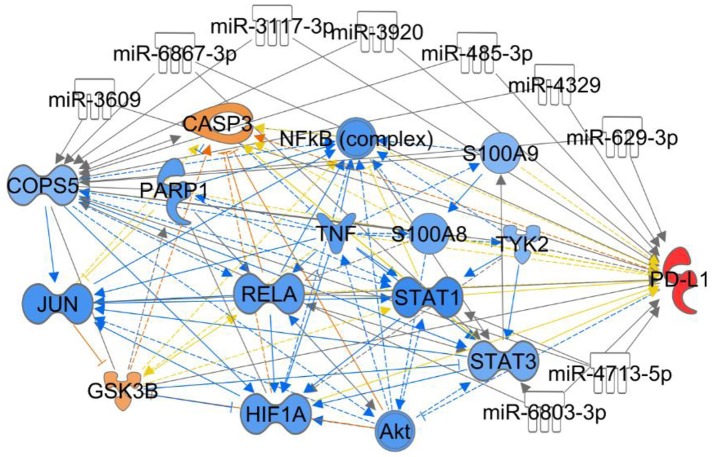
Figure 4.
Ingenuity Pathway Analysis for the interaction between Jab1/COPS5 and PD-L1. In this case we showed the predicted expression level of other genes in the regulation network in response to increased measured level of PD-L1 based on the IPA database. The miRNAs in the figure are predicted ones that can target both Jab1/COPS5 and PD-L1, but no demonstration was reported yet. The color of each gene represents the corresponding expression level. Light-red means activation and light-blue means inhibition, while red means increased measurement and green means decreased measurement.

