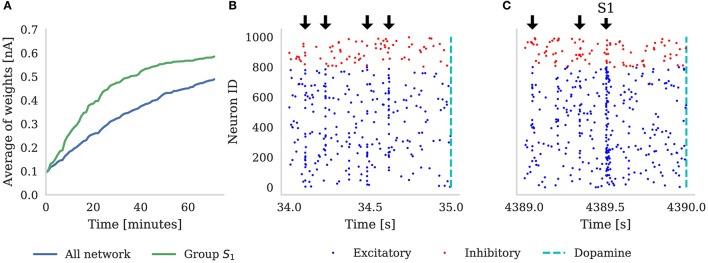
Figure 5.
(A) Shows the average synaptic weight of synapses from the group of neurons representing S1 (green) and every synapse in the network (blue) for the first hour of the experiment. Randomly selected stimuli Sk are delivered to the network (black arrows), separated by random intervals of between 100 and 300 ms. These are visible in the synchronous spikes in (B,C). Every time S1 is chosen, dopamine is delivered to the network (dashed line). Raster plot (B) depicts the first 1 s of network activity when S1 was delivered to the network; and (C) illustrates 1 s of activity after 1 h of simulation, showing how the neurons stimulated by S1 have learned to respond more strongly. Note that in (A), the average of all the weights is increasing because, additionally to S1 always being rewarded, some stimuli Sk ≠ S1 also randomly get picked up soon before or after reward is delivered to the network.

