Figure 3.
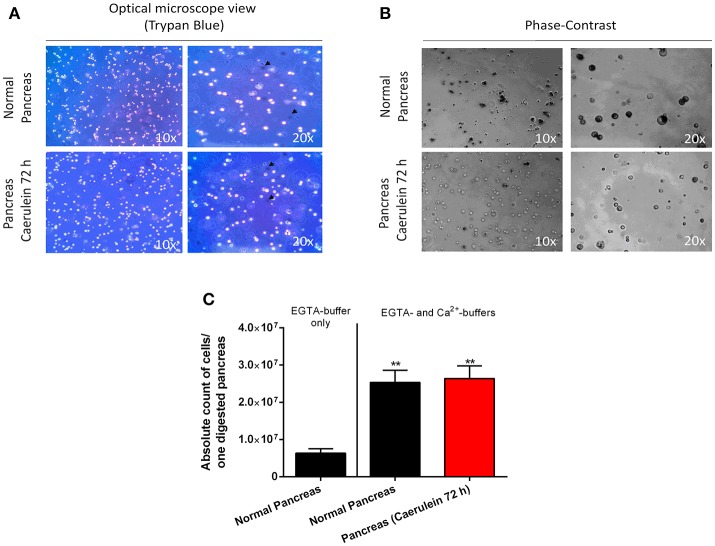
Assessment of cell viability, morphology, and count. (A) Cells from normal and caerulein-treated pancreas were mixed with trypan bleu dye (1:2) directly after digestion, then put in a Petri dish and visualized under an optical microscope (view 10 x and 20 x). Dead cells incorporated trypan blue and appeared dark (black arrows). (B) Phase-contrast images were taken for cells isolated from normal and caerulein-treated pancreas (view 10 x and 20 x). Cells from normal pancreas appeared larger and darker. (C) Absolute cell count was performed on 20 μL of digestion solution, using an automated hemocytometer. The EGTA-buffer only condition was shown to illustrate the low number of cells obtained when only this solution was used. Results were presented as mean ± SEM (EGTA-buffer only: n = 3; normal pancreas with EGTA- and Ca2+-buffers: n = 16; caerulein-treated pancreas 72 h with EGTA- and Ca2+-buffers: n = 17). Statistical significance was determined using a t-student test and p-values were considered statistically significant when P < 0.05 (**P < 0.01, compared to EGTA-buffer only).

