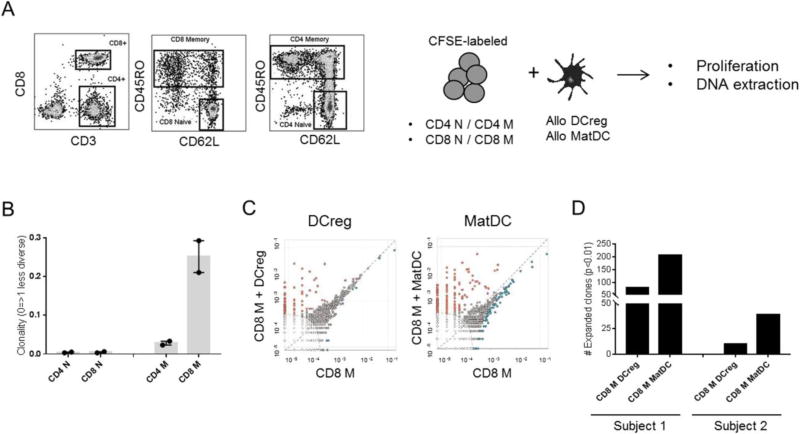
Fig. 7.
Clonotypic analysis of alloreactive T cells stimulated with DCreg. (A) Gating strategy used to FACS sort naïve (N) and memory (M) CD4 and CD8 T cell subsets. Each sorted population was cultured with allogeneic DCreg or matDC in 5-day CFSE-MLR. DNA purified from each condition was amplified by PCR amplified and sequenced for the TCRVβ locus using the Adaptive Technologies platform. (B) TCR repertoire diversity within unstimulated T cell subsets (n=2 healthy individuals). (C) Comparison of shared alloreactive TCR clonotypes between unstimulated M CD8+ T cells (x-axis) and DC-stimulated M CD8+ T cells (y-axis). Dots on the axes represent the frequency of TCR clonotypes that were found in one population but not the other, while those close to the diagonal dotted line represent frequency equality. Significantly expanded clones are highlighted in orange. The elliptical dotted line signifies the threshold for statistical comparison. Representative data from Subject 1. (D) Numbers of alloreactive clones expanded after 5-day MLR stimulation with allogeneic DCreg or matDC. Data from both subjects are shown.

