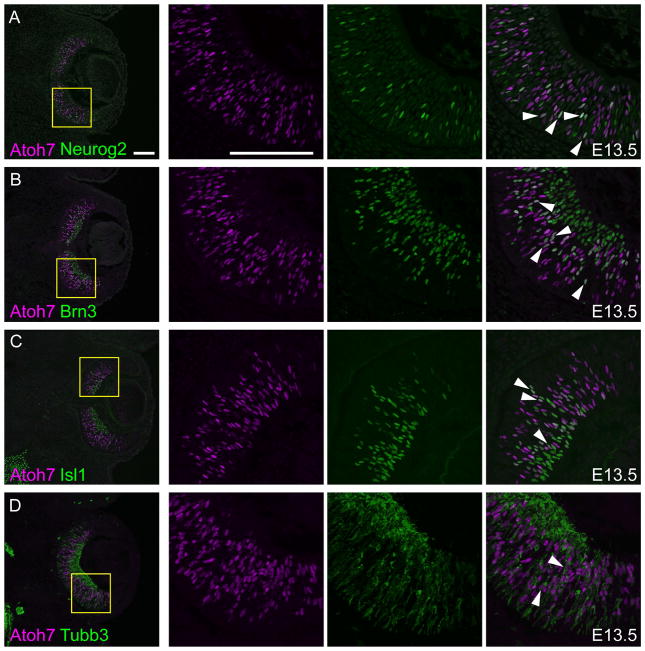
Fig. 4. Atoh7 overlaps established markers of retinal ganglion cell differentiation.
Comparison of Atoh7 (magenta) with [A] Neurog2, [B] pan-Brn3 (Pou4f), [C] Isl1 and [D] Tubb3 (green) in E13.5 retinal sections. Co-localized nuclear signals appear white in merged views (arrowheads). In each row, the three right panels show single-channel and merged views at higher magnification (yellow boxes). Scale bars, 100 μm.

