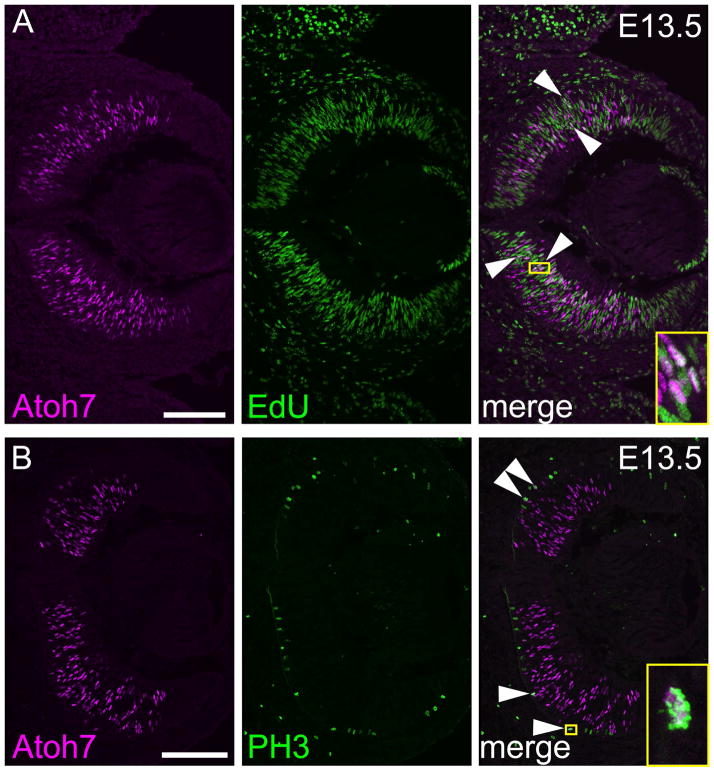
Fig. 6. Coexpression of Atoh7 and proliferative markers in E13.5 RPCs.
Co-labeling E13.5 retina with Atoh7 (magenta) and [A] EdU (green) or [B] PH3 (green). A subset of Atoh7+ PH3+ cells at the apical surface of the retina are indicated (arrows). Insets (yellow) show magnified views of double-positive cells. Each panel is a composite of two images collected at 200X magnification. Scale bars, 100 μm.

