
Figure 2. Effects of neonatal ethanol exposure and choline treatments on morphometric parameters of apical dendrites of CA1 pyramidal neurons in PD9 female pups.
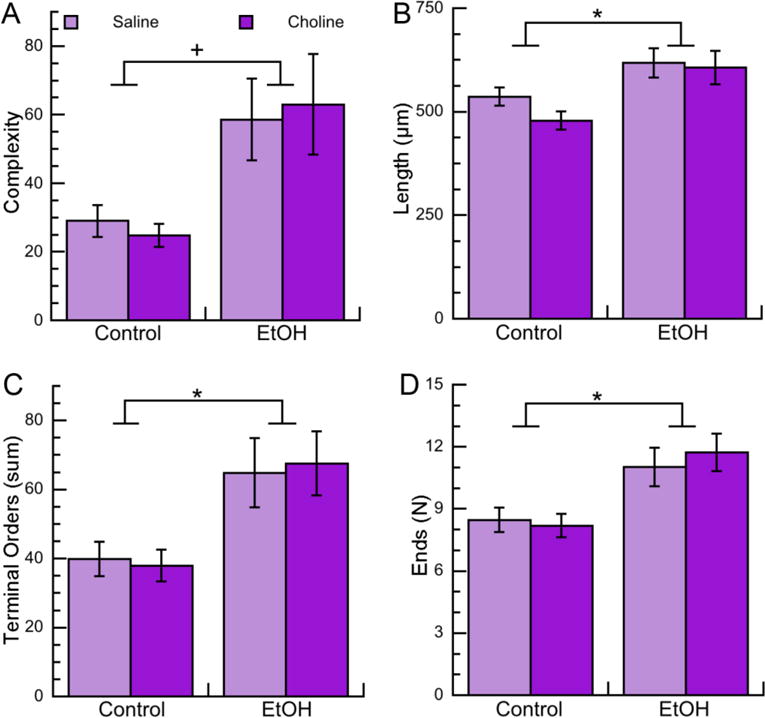
Morphometric measurements of apical dendrites of CA1 pyramidal neurons from female PD9 rats exposed to 5 g/Kg/day ethanol and/or 100 mg/Kg/day choline between PD4 and PD9 were analyzed by Neurolucida Explorer. A: Apical dendrite complexity (1,000×); a composite measurement defined as [(sum of terminal orders + number of ends)*(total dendrite length/number of primary dendrites)]. B: Apical dendrite length (in μm). C: Apical dendrite sum of terminal orders (defined as the number of “sister” branches encountered from each end to the cell body). D: Number of ends per apical dendrite. Shown in each graph is the mean ± the standard error from 48 neurons per condition (with the exception of the Chol group that had 36 neurons). Multilevel analysis was carried out on log-transformed data. On data shown in B, C, and D we employed multiple comparison corrections using the Benjamini-Hochberg approach to adjust nominal p-values toFDR. +p<0.05; *q<0.05 (after FDR correction).