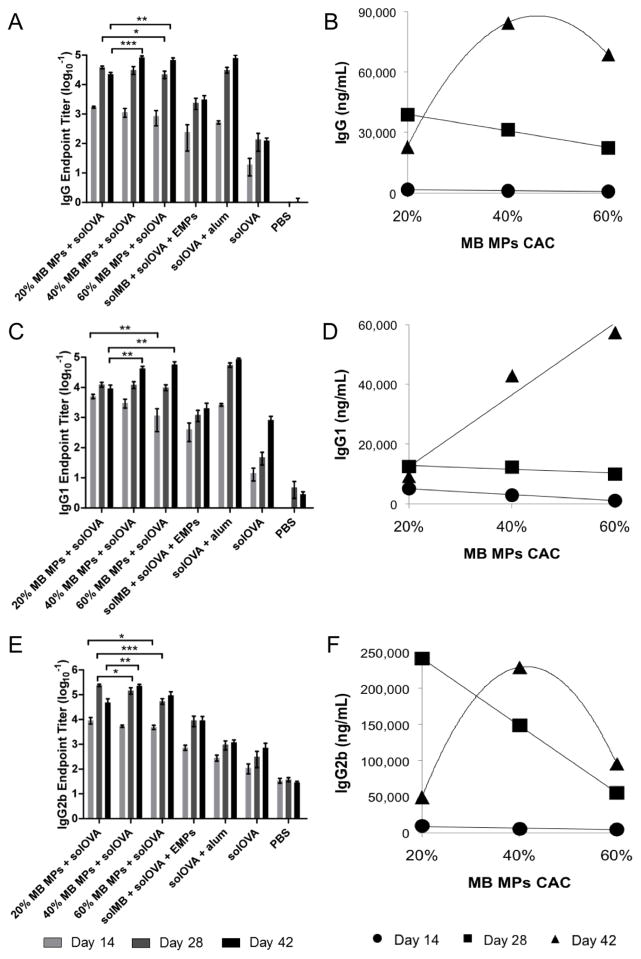
Figure 5.
(A, B) Total IgG, (C, D) IgG1, and (E, F) IgG2b anti-ovalbumin (OVA) antibodies in mouse sera collected on Day 14, 28, and 42 post vaccination with murabutide (MB) microparticles (MPs), soluble ovalbumin (solOVA), soluble MB (solMB), empty MPs (EMPs), Alhydrogel (alum), or PBS. (B, D, F) Antibody levels for MB MPs + solOVA treatment were plotted against MP cyclic acetal coverage (CAC) with best-fitted functions as a visual guide. Data are displayed as (A, C, E) the mean logarithmic transformation (base 10) of the titers (ng/mL) ± standard error of the mean or (B, D, F) mean ± standard error of the mean (n = 8 except for Day 42 where n=4). Statistical significance between the groups of interest (MB MPs + solOVA) at various time points is presented as *p < 0.05, **p < 0.01, and ***p < 0.001.

