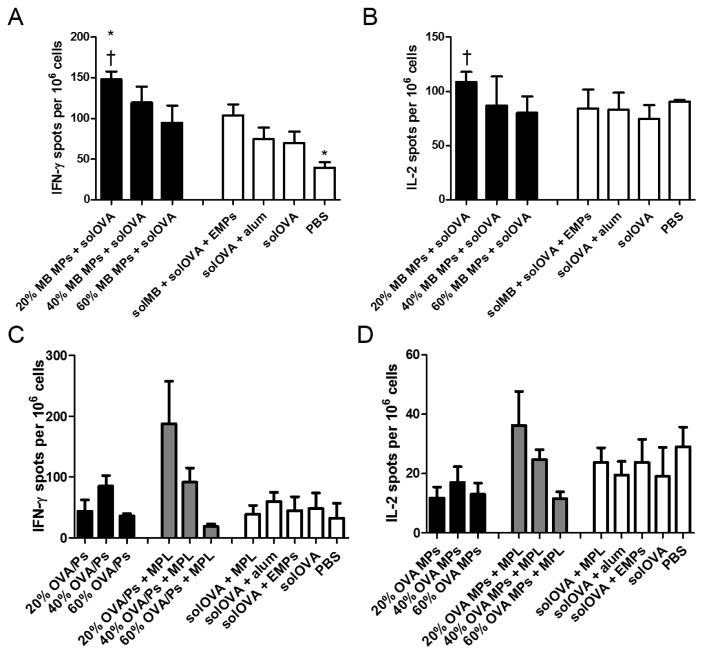
Figure 8.
T-cell responses in spleens of C57Bl/6 mice measured by (A, C) interferon (IFN)-gamma (γ) and (B, D) interleukin (IL)-2 ELISpot. Splenocytes were isolated on day 28 post vaccination with (A, B) murabutide (MB) microparticles (MPs), soluble ovalbumin (solOVA), soluble MB (solMB), empty MPs (EMPs), Alhydrogel (alum), or PBS, or (C, D) ovalbumin (OVA) microparticles (MPs), monophosphoryl lipid A (MPL), soluble OVA (solOVA), aluminum (alum), empty MPs (EMPs), or PBS on days 0 and 21. Statistical significance with respect to EMPs is presented as *p < 0.05. Statistical significance with respect to solOVA is presented as †p < 0.05. Data are presented as mean ± standard error of the mean (n = 4).

