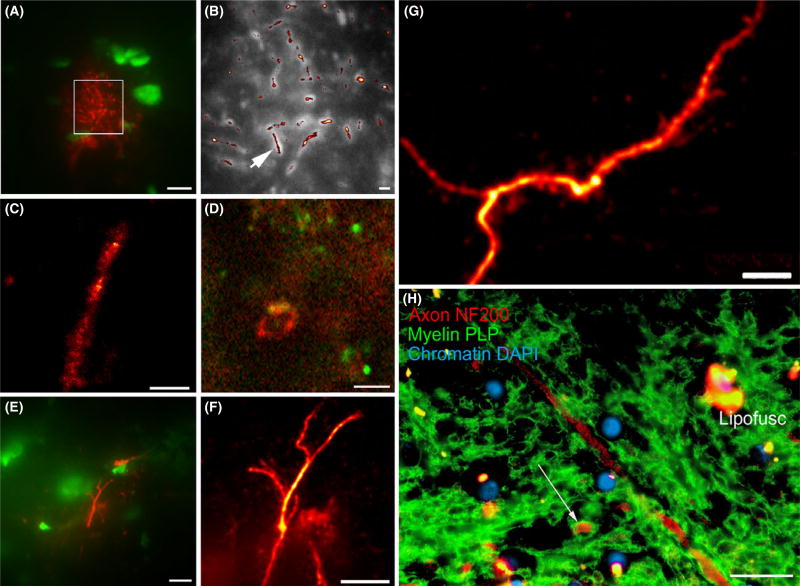
Figure 1.
Example direct stochastic optical reconstruction microscopy (dSTORM) images of axonal neurofilaments, myelin and astroglial processes within brain white matter. (A) axons immunolabelled with neurofilament (red) in human subcortical white matter, context image under conventional light microscopy. Nuclei are labelled by the chromatin marker YOYO-1 (green). Region of interest for STORM imaging marked with box. (B) STORM image (red) from A, overlaid on conventional image (greyscale). An arrow indicates the axon shown in panel C. (C) STORM imaged individual axon, from the field highlighted in panel B. (D) myelin sheath in cross-sectional profile in human sub-cortical white matter, immunolabelled with myelin-associated glycoprotein. (E) GFAP-immunolabelled astrocyte filamentous processes in mouse corpus callosum, context images under conventional light microscopy. (F) Super-resolution optical fluctuation imaging (SOFI) image of astroglial filamentous process, from field of view shown in E. (G) SOFI image of GFAP-immunolabelled astrocyte filamentous process in rat corpus callosum. (H) conventional epifluorescence image of human subcortical white matter, double labelled for axonal neurofilaments (red) and the myelin sheath protein PLP (green). Nuclear chromatin is counterstained with DAPI (blue). Note a myelinated axonal profile (arrow). Autofluorescent bundles of lipofuscin (‘Lipofusc’) are relatively sparse in this field of view. Scale bars: 10 µm (A,E), 1 µm (B), 500 nm (C), 2 µm (D,G), 5 µm (F), 20 µm (H).

