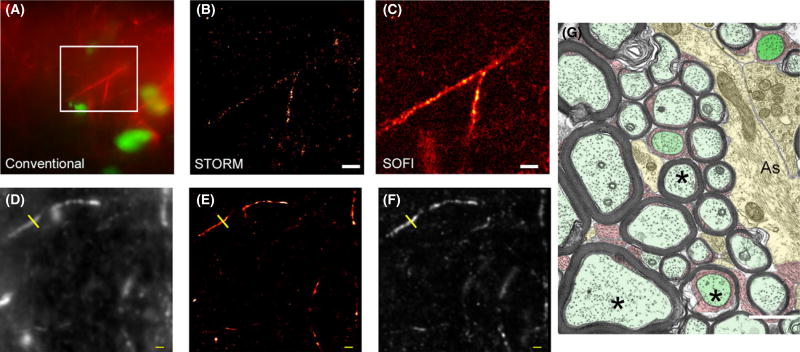
Figure 2.
Example of quantitative measurements from direct stochastic optical reconstruction microscopy (dSTORM) and super-resolution optical fluctuation imaging (SOFI) experimental data. (A–C) Comparison of conventional epifluorescence (A), dSTORM (B) and SOFI (panel C) images of the same field of view. Rat corpus callosum immunolabelled for astrocyte filaments (GFAP, red). Nuclear chromatin is stained with YOYO-1 (green). A branched astrocytic process is clearly seen in all three images. The branching process visible in the epifluorescence image is not well resolved by dSTORM, probably because fluorophore localizations are too sparse to fully define the structure. When the same raw data are analysed by SOFI the complete structure can be seen, albeit at somewhat lower resolution. Scale bars 2 µm. (D–F) Mouse brain section immunolabelled for axonal neurofilament NF200. (D) Conventional diffraction-limited image; (E) dSTORM image; (F) SOFI image. Yellow line indicates the location of intensity profiles shown in Figure 3. Scale bar 1 µm. (G) For comparison, transverse electron microscopy images are shown for the corpus callosum of an adult monkey (age 6 year). For nerve axons (marked with asterisks, *), a wide range of axonal diameters is clearly apparent. Myelin sheaths are visible, again with a range of thickness. Astrocyte processes (labelled ‘As’) can be seen, containing bundles of filaments. Myelinated axons- pale green; astrocytes- yellow: paranodes and nodes- dark green: oligodendrocyte process- red. Scale bar 1 µm. Reproduced from Boston University website www.bu.edu/agingbrain/.

