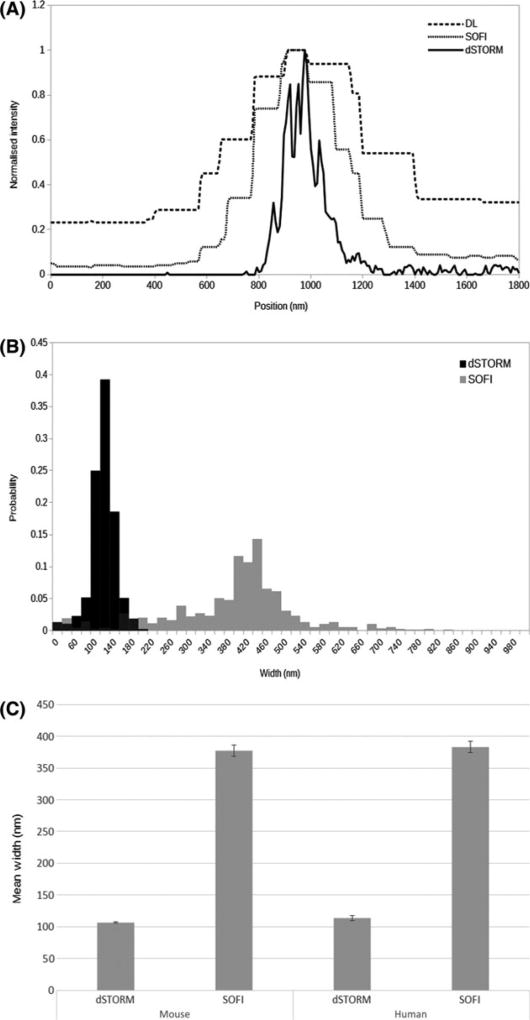
Figure 3.
Comparison of quantitative results from direct stochastic optical reconstruction microscopy (dSTORM) and super-resolution optical fluctuation imaging (SOFI) experimental data. (A) Comparison of line profiles through an axonal process as indicated in Figure 2D–F, for diffraction-limited (dashed line) SOFI (dotted line) and STORM (solid line) images. Note the stepped nature of the diffraction-limited and SOFI graphs, due to the larger pixel sizes (160, 80 and 8 nm for diffraction-limited, SOFI and dSTORM, respectively) and the progressively narrower axonal profiles reported. (B) Normalized histogram of mean axonal widths determined for NF200 immunolabelled neurofilaments in mouse and human brain white matter, derived from dSTORM (solid bars) and SOFI analyses (grey bars). (C) Mean axonal widths, derived from neurofilament (NF200) immunolabelled mouse brain tissue by dSTORM and SOFI. Error bars indicate 95% confidence limits.

