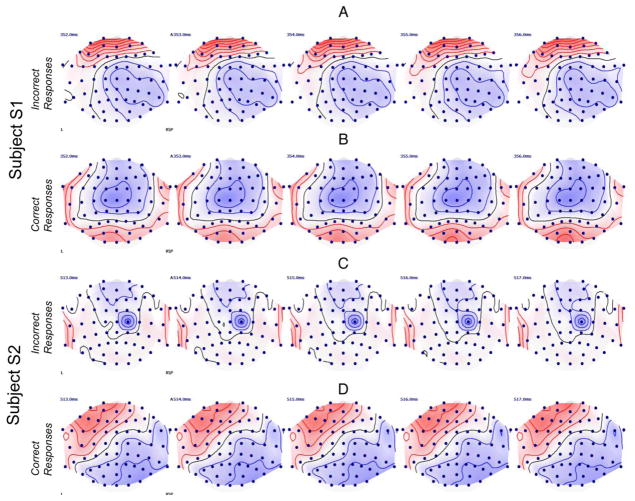
Figure 2.
The topographic maps of the measured potentials in a 5 ms time-window where the TANOVA analysis revealed significant differences (p<0.05) between the Incorrect and Correct responses for participant S1 (panels A & B) and participant S2 (panels C & D). Red contour lines display positive potentials; blue contour lines display negative potentials. The black line is the line of zero voltage. The ranges of the displayed potentials were the same for all four plots.

