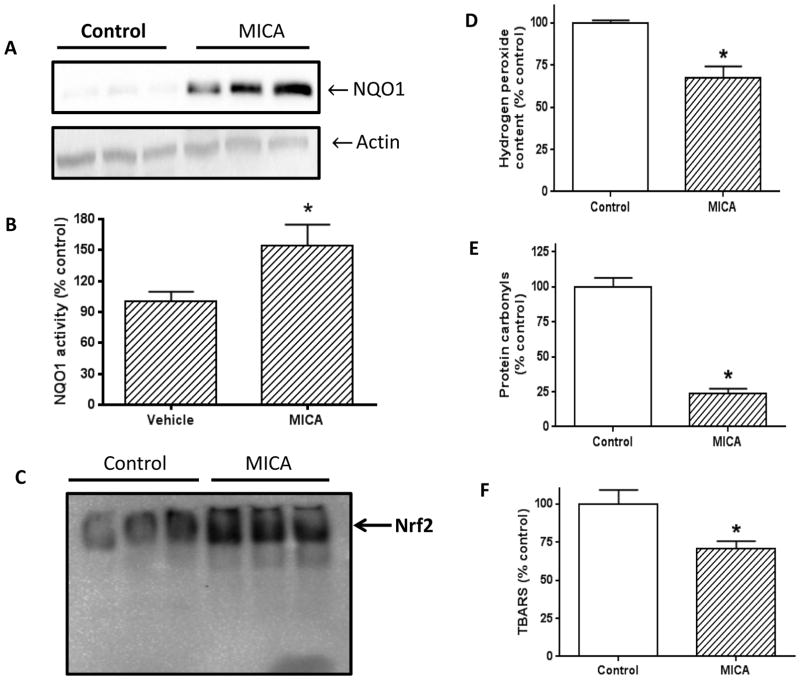
Fig. 4.
A) NQO1 expression determined by Western blot assay (N=3 for each group). B) Comparison of densitometric quantitation of gel bands between control and MICA shown in A. C) Comparison of electro-mobility of Nrf2 transcription factor between control and MICA. D) Comparison of H2O2 production between control and MICA. E) Comparison of protein carbonyl content between control and MICA. F) Comparison of lipid peroxidation (as TBARS) between control and MICA.

