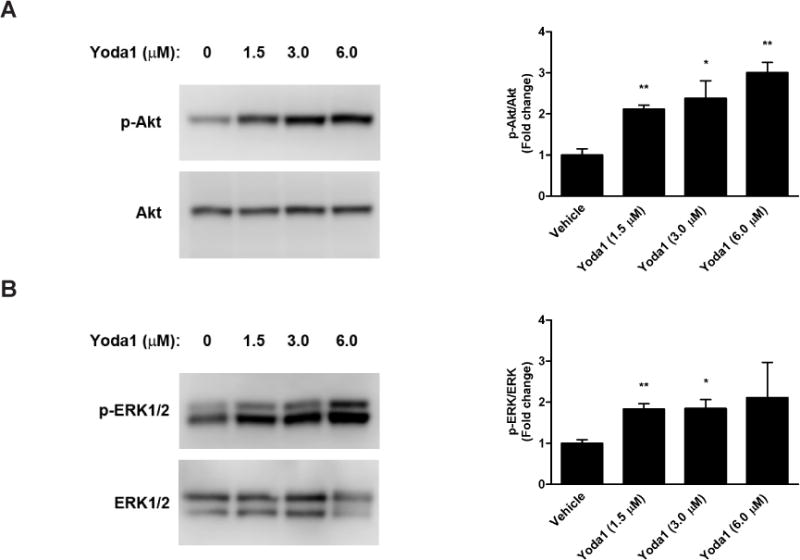
Figure 1. Yoda1-induced signaling in endothelial cells.

Human coronary artery endothelial cells (HCAECs) were treated with Yoda1 at the indicated concentrations for 5 min. Cell lysates were prepared and analyzed by performing SDS-PAGE followed by immunoblotting. (A) Akt activation was determined by immunoblotting for phosphorylated Akt (S473) and total Akt and performing densitometry of the single band. (B) ERK1/2 activation was determined by immunoblotting for phosphorylated ERK1/2 (T202/Y204) and total ERK1/2 and performing densitometry of the protein doublet. Representative blots from at least 3 independent experiments are shown. Bar graphs represent the quantification as fold change in the ratio of phosphorylated Akt to total Akt (A) or phosphorylated ERK1/2 to total ERK1/2 (B) compared to the DMSO-treated control condition, which is set to 1. The error bars indicate SE. *P<0.05; **P<0.01.
