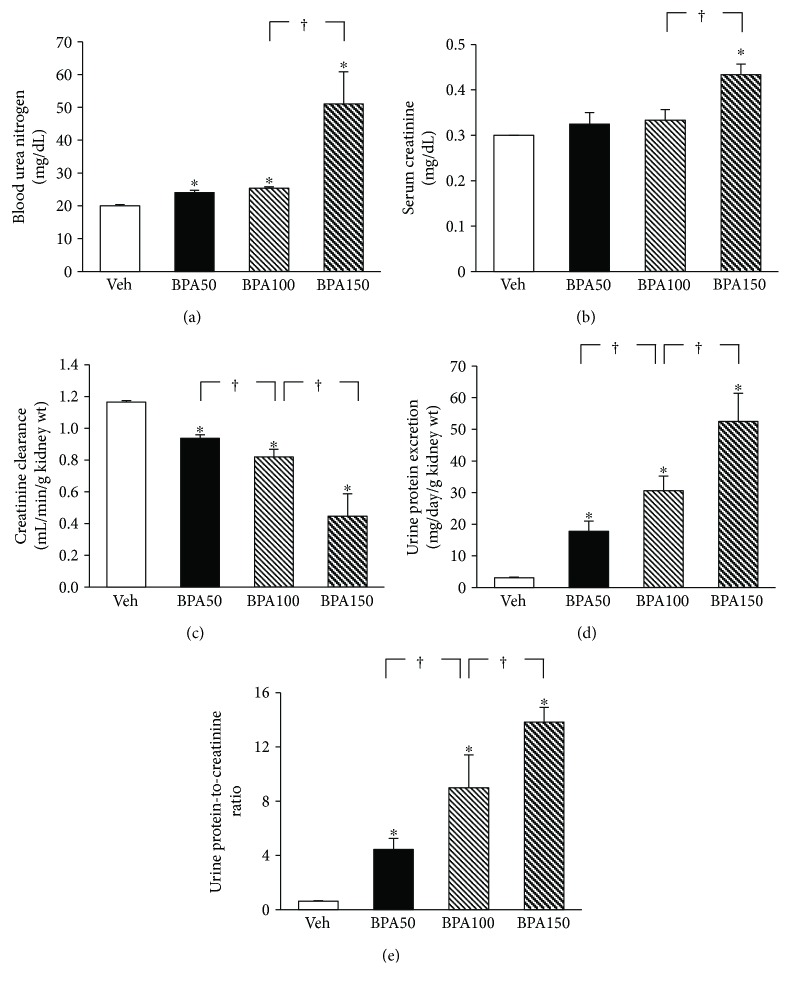
Figure 1.
Effects of various concentrations of bisphenol A (BPA) on renal function. Values are means ± SEM (n = 4). Veh: vehicle-treated group; BPA (50, 100, and 150): BPA-treated group at 50, 100, and 150 mg/kg i.p., respectively, for 5 weeks. ∗P < 0.05 versus Veh, †P < 0.05 between BPA-treated groups.

