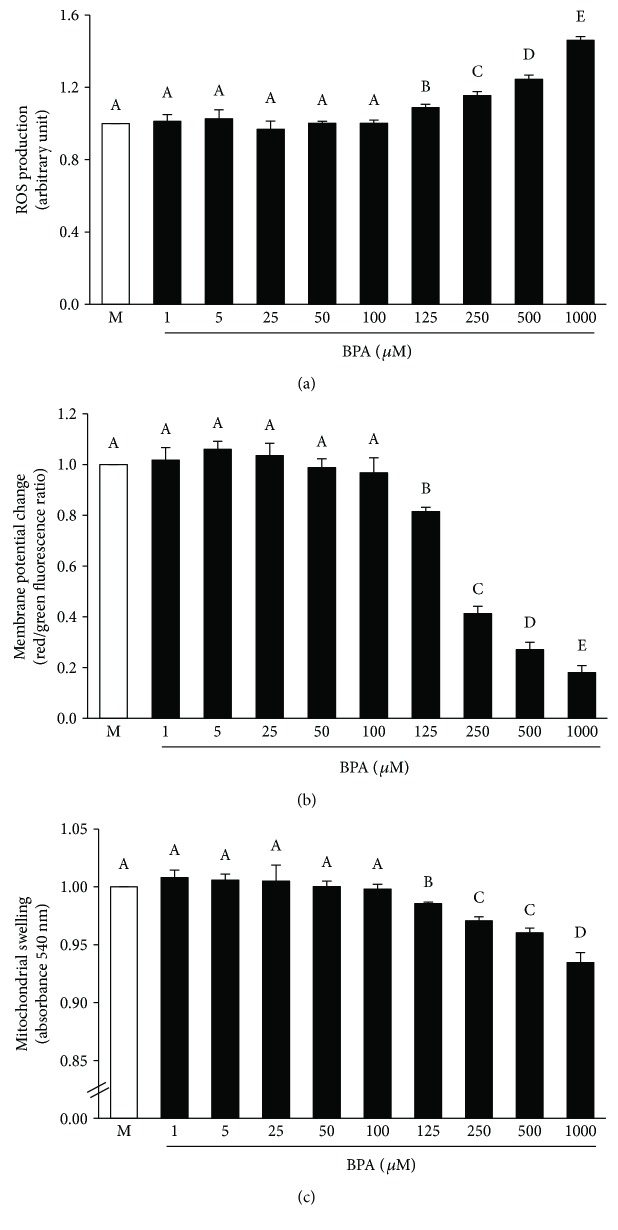
Figure 9.
Effects of various concentrations of bisphenol A on isolated kidney mitochondrial function. Values are means ± SEM from the 5 experiments. M: vehicle-treated mitochondria; BPA (1, 5, 25, 50, 100, 125, 250, 500, and 1000): bisphenol A-treated mitochondria at 1, 5, 25, 50, 100, 125, 250, 500, and 1000 μM, respectively. a–eDifferent letters denote significant difference at P < 0.05.

