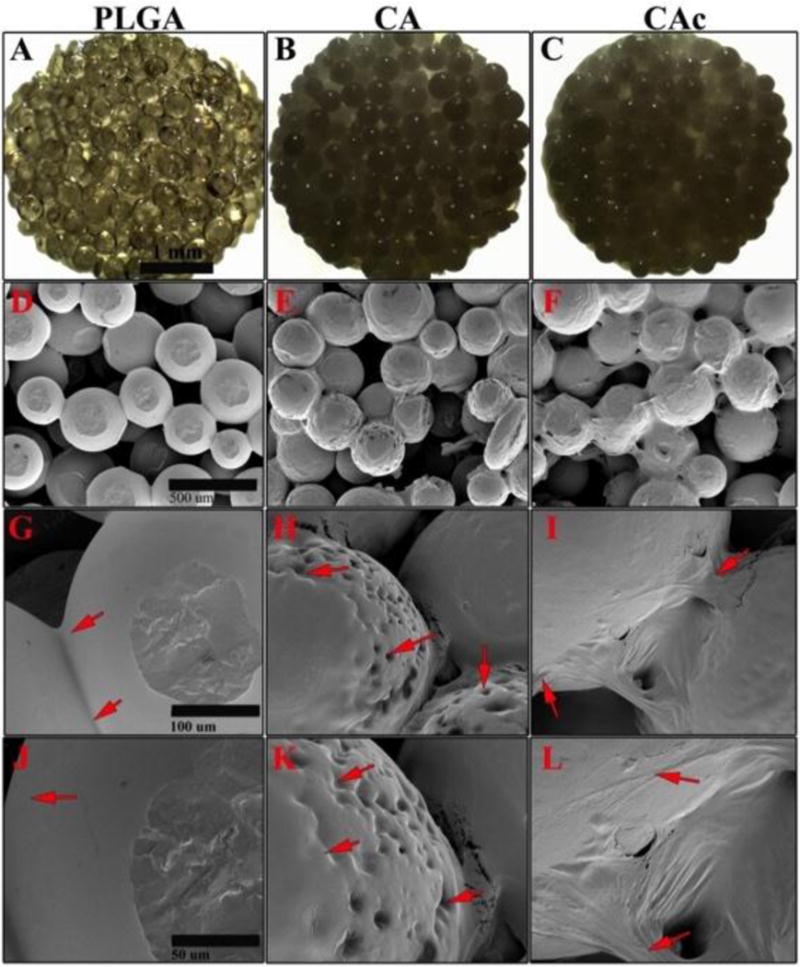
Figure 2. Examination of scaffold structure.

Photographic images of 3D microporous scaffolds used (A) PLGA, (B) CA, (C) CAc, scale bar= 1mm; SEM images at 100× magnification (D) PLGA, (E) CA, (F) CAc, scale bar= 500μm; SEM images at 500× magnification (G) PLGA, (H) CA, (I) CAc, scale bar= 100μm; SEM images at 1000× magnification (J) PLGA, (K) CA, (L) CAc, scale bar= 50μm.
