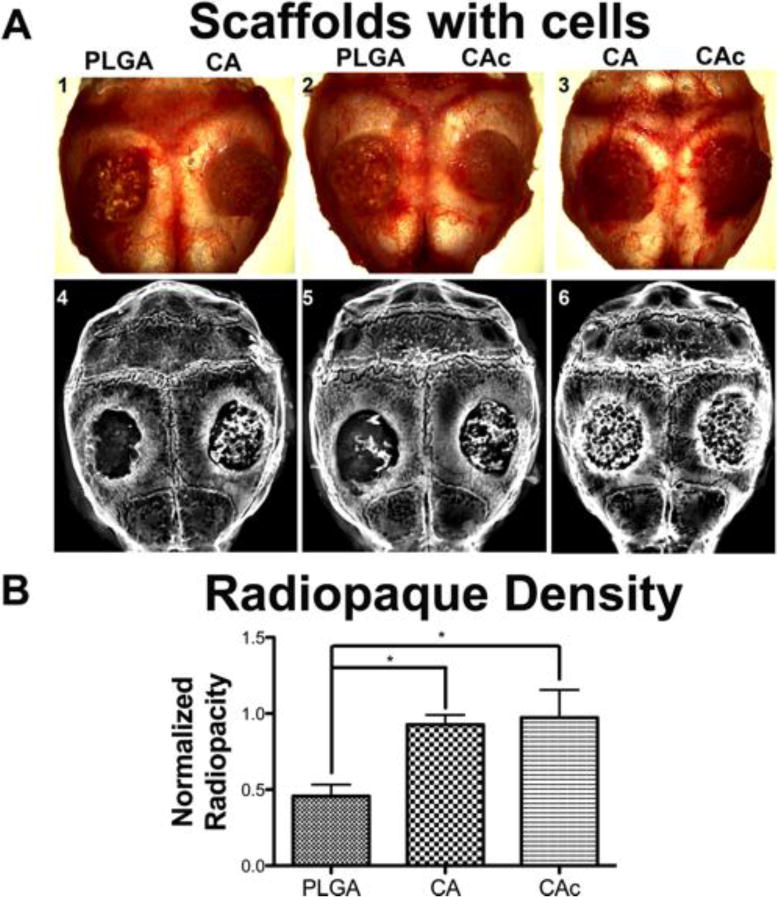
Figure 3. Whole calvaria and X-ray radiograph of defects implanted with materials and cells.

(A) Top panel: 1. Group 1-PLGA vs CA, 2. Group 2-PLGA vs CAc, 3. Group 3-CA vs CAc.; X-ray radiographs of 4. Group 1-PLGA vs CA, 5. Group 2-PLGA vs CAc, 6. Group 3-CA vs CAc. (B) Quantitative radio opacity of defect area normalized to radio opacity of host bone, both measured per unit area; PLGA, n=6; CA, n=6; CAc, n=7. One-way ANOVAwith Tukey post-test, with 95% confidence intervals, *P < 0.001.
